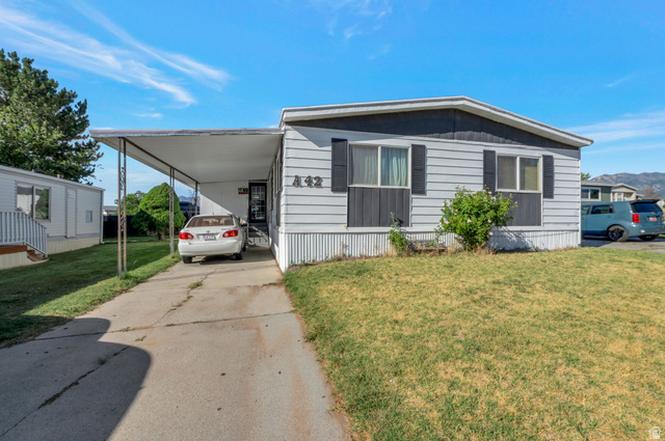
3860 S Midland Dr S Unit A42 · Roy, UT
Flood risk 1/10 · Minimal
- FEMA flood zone
- X (unshaded)
- Chance of flooding over 30 yrs
- 0.0%
- Est. flood insurance / yr
- $507 – $1,088
Fire risk 1/10 · Minimal
- Est. fire insurance / yr
- $453 – $841
Heat risk 4/10 · Minor
- Hot days now (above 94°F)
- 6 days/yr
- Hot days in 30 yrs
- 15 days/yr
Wind risk 1/10 · Minimal
- Chance of severe wind over 30 yrs
- —
Air-quality risk 4/10 · Minor
- Unhealthy air days now
- 4 days/yr
- Unhealthy air days in 30 yrs
- 5 days/yr
Risk factors via First Street. Map © Google.
Why this score? — see what drove the C+ grade
The composite is a weighted blend of 9 inputs, each scored 0–100. Each bar is that input's sub-score; the figure is the points it added to the 100-point composite (weight × sub-score).
- Cash flow +25.9/30.0
- 1% rule +10.0/10.0
- DSCR +8.7/10.0
- ARV discount +7.5/15.0
- Livability +4.0/5.0
- Schools +3.2/10.0
- Condition / age +2.5/5.0
- Rent growth +2.4/5.0
- Appreciation +0.0/10.0
$104,900
🖨 Deal sheet (PDF) 📄 Offer letter ✓ Due diligence
Listing remarks MLS
There are no remarks available.
Key facts
- 5 parking spots
- Community pool
- Built 1978
Property features AI
Finance
- HOA & community: Has homeowners association (Midland Community); Monthly association fee of $769; Association fee includes sewer, trash and water; Community clubhouse, playground, hiking trails and pool
Exterior
- Parking: Total 5 parking spaces; 1 covered/carport space; 4 open parking spaces; RV parking
- Utilities: Natural gas connected; Electricity connected; Sewer connected; Culinary (municipal) water
- Home design: Mobile home; Single-level living; Built and currently standing; Residential use; View: Mountain
- Construction: Asphalt roof; Built/standing construction
- Exterior features: Covered patio; In-ground fenced pool; Mountain view; Landscaped
Interior
- Kitchen: Updated kitchen; Range hood; Refrigerator; Disposal
- Bedrooms: 4 main-level bedrooms
- Flooring: Vinyl
- Bathrooms: 3 three-quarter bathrooms
- Heating & cooling: Forced air heating; Central air conditioning; Has heating and cooling
- Interior features: Primary bathroom; Updated kitchen; Disposal; Range hood; Refrigerator; 11 total rooms; No basement
- Laundry & utility: Electric dryer hookup
Neighborhood map
What this means for you Summary
Snapshot
- This is a 4-bed/3.0-bath manufactured listed at $105k.
Deal economics
- At list price, monthly cash flow is $257 ($3k/yr) — positive.
- The deal already cash-flows at list — no discount required.
- Meets the 1% rule at list price ($2k rent vs $105k).
Location & tenants
- Location reads 81/100 on livability (#32 in UT, #1,449 nationally) — a professional / high-income tenant draw. Strengths: housing A+, health & safety A+, commute A; Watch: amenities F.
- Weber District (suburban): math 36% / reading 35% proficiency, ranked #56 of 80 in UT (top 70%) — families likely to look elsewhere, expect single-tenant / working-renter base with shorter leases.
- Zoned schools: North Park School (math 32% / reading 32%, grade F, #419 of 585 statewide, top 72%, 467 students, 50% FRL); Roy Jr High (math 23% / reading 25%, grade F, #123 of 138 statewide, top 90%, 1,008 students, 37% FRL); Roy High (math 15% / reading 39%, grade F, #131 of 171 statewide, top 79%, 1,834 students, 28% FRL).
- Market conditions: Rents soft (-0.5%/yr); 203 active listings in the ZIP; 19 comparable units currently listed for rent nearby; rentals at typical pace (median 16d on market — plan ~3-4 weeks tenant-placement turnaround); solid renter incomes; 1,630 units permitted in Weber County in 2024 (521 in 5+ unit buildings).
Forward outlook
- Local home prices are declining (-3.0%/yr); year-one equity from $725 of loan paydown is wiped out by about $3k of value loss. Plan a longer hold.
- Weber County population projected at +24% by 2050 — long-run rental-demand tailwind backs the buy-and-hold thesis.
Negotiation context
- Only 1 days on market — expect competitive offers; lowballing is unlikely to land.
- 3 sale attempts since 28y ago with the ask held roughly flat each time — persistent listings suggest the price (not the market) is what's stuck; bring a comps-based counter.
Risks & watch-outs
- Watch-outs: HOA is 35% of rent.
Questions for the listing agent
- Built in 1978 — when were the roof, HVAC, electrical panel, plumbing, and water heater last replaced?
- What does the HOA fee cover, when was the last increase, and are there any pending special assessments or reserve-fund shortfalls?
- Is there a deadline driving the sale (1031 exchange, divorce, estate, relocation)? That informs how much negotiation room exists.
- Schools are D-rated, which usually means shorter tenancies and higher turnover. Who's the typical renter profile here, and what's been the actual vacancy rate?
- What's the average days-on-market for RENTAL listings here right now (not sales)? A rising rental-DOM trend means longer vacancies and softer asking-rent achievability than the comps imply.
- What's the recent tenant-quality profile in this submarket — average credit score on applications, eviction rate, late-payment / NSF rate, and stable-employment percentage? A property-management company in the area should have these aggregated.
- How much new for-sale + rental construction is in the pipeline within 1–3 miles? Heavy new supply typically softens prices + rents 12–24 months out; constrained supply supports both.
Investment metrics
- 1% rule
- 2.11% ✓
- Cap rate
- 9.23%
- Cash-on-cash
- 10.50%
- DSCR
- 1.47
- GRM
- 3.9
CMA / ARV
No comps found within radius.
Projected returns pro-forma
-3.0% appreciation · 0.0% rent growth · sell at horizon
- IRR
- -6.4%
- Equity multiple
- 0.77×
- Total profit
- $-6,619
- Equity at exit
- $15,641
- IRR
- -5.4%
- Equity multiple
- 0.74×
- Total profit
- $-7,733
- Equity at exit
- $9,070
Cash invested: $29,372 (down + closing). Projections, not guarantees.
Landlord ↔ Tenant lean methodology
- Overall (STATE)
- 86 Strongly Landlord-Friendly
- State Utah
- 86 Strongly Landlord-Friendly · R+15
- County
- — inherits STATE
- City
- — inherits STATE
ZIP-level market 84067
- Rents YoY
- -0.5%
- Active inventory
- 203
- Price-to-rent
- 3.9×
Monthly cashflow live
- Estimated rent
- $2,216 high interval (Pro) →
- Mortgage (P&I)
- −$550
- Tax est. 1.5%
- −$131 /mo · $1,574/yr
- Insurance
- −$44
- HOA
- −$769
- Vacancy / Maint / Mgmt
- −$465
- Net cashflow
- $257
Break-even live
Sensitivity live
| Price | -10% $329 | -5% $293 | +0% $257 | +5% $221 | +10% $185 |
|---|---|---|---|---|---|
| Rent | -10% $82 | -5% $169 | +0% $257 | +5% $345 | +10% $432 |
| Rate | -1.0pp $310 | -0.5pp $284 | base $257 | +0.5pp $230 | +1.0pp $202 |
UW: 25.0% down · 7.5% · 30yr · 1.5% tax · 5.0% vac · 8.0% maint · 8.0% mgmt
Financing live
Cash to close
- Down payment
- $26,225
- Closing costs
- $3,147
- Reserves months
- —
- Total cash needed
- —
Loan-product check · same deal, 3 products live
Conventional
25% down · 7.5% · 30yr
- Down + closing
- —
- Monthly P&I
- —
- Monthly cashflow
- —
- DSCR
- —
- Eligible?
- —
Personal DTI + credit; lowest rate.
DSCR
20% down · 8.5% · 30yr
- Down + closing
- —
- Monthly P&I
- —
- Monthly cashflow
- —
- DSCR
- —
- Eligible?
- —
No personal income docs; deal must DSCR.
Hard money
10% down · 12.0% · 12mo
- Down + closing
- —
- Monthly P&I
- —
- Monthly cashflow
- —
- DSCR
- —
- Eligible?
- —
Short-term bridge; refi at stabilization.
Rent comps 19 comps
| Address | Beds | Baths | Sqft | Rent | $/sqft | DOM | Units | Dist |
|---|---|---|---|---|---|---|---|---|
| 2632 W 4050 S Roy, UT | 5.0 | 3.0 | 2000 | $2,100 | $1.05 | 15d | 1 | 0.21mi |
| 2914 W 3885 S West Haven, UT | 3.0 | 2.5 | 1440 | $2,395 | $1.66 | 24d | 1 | 0.32mi |
| 2778 W 4175 S #236 Roy, UT | 3.0 | 2.5 | 2190 | $2,000 | $0.91 | 24d | 1 | 0.37mi |
| 4156 S 2825 W #215 Roy, UT | 4.0 | 3.5 | 2100 | $2,200 | $1.05 | 15d | 1 | 0.38mi |
| 3560 Midland Dr West Haven, UT | 1.0–3.0 | 1.0–2.0 | 932 | $1,599 | $1.71 | 15d | 22 | 0.63mi |
| 3243 W 3875 S #315 West Haven, UT | 3.0 | 2.5 | 1780 | $2,100 | $1.18 | 20d | 1 | 0.68mi |
| 4389 S Locomotive DR Roy, UT | 2.0–4.0 | 2.5–3.5 | 1651 | $2,750 | $1.67 | 15d | 48 | 0.69mi |
| 3405 S 2400 W West Haven, UT | 1.0–3.0 | 1.0–2.0 | 978 | $1,800 | $1.84 | 24d | 5 | 0.69mi |
| 3728 S 3300 W West Haven, UT | 3.0 | 2.5 | 1630 | $2,095 | $1.29 | 20d | 1 | 0.76mi |
| 3318 W 3745 S Ogden, UT | 3.0 | 2.5 | 1579 | $1,895 | $1.20 | 15d | 1 | 0.78mi |
| 3321 W 3785 S Unit 4007 West Haven, UT | 3.0 | 2.5 | 1600 | $1,995 | $1.25 | 20d | 1 | 0.78mi |
| 3330 W 4000 S West Haven, UT | 1.0–3.0 | 1.0–2.0 | 1048 | $2,072 | $1.98 | 15d | 22 | 0.80mi |
| 3384 W 4225 S West Haven, UT | 4.0 | 3.0 | 1759 | $2,495 | $1.42 | 24d | 1 | 0.91mi |
| 2015 Carson Ave West Haven, UT | 3.0 | 2.5 | 2049 | $2,500 | $1.22 | 24d | 1 | 0.96mi |
| 3330 S Midland Dr West Haven, UT | 1.0–3.0 | 1.0–2.5 | 1000 | $1,750 | $1.75 | 15d | 3 | 1.03mi |
| 3327 W 4350 S West Haven, UT | 5.0 | 3.0 | 1870 | $2,495 | $1.33 | 15d | 1 | 1.04mi |
| 4719 S 2900 W Roy, UT | 4.0 | 3.0 | 2160 | $2,500 | $1.16 | 24d | 1 | 1.09mi |
| 2112 W 3300 S West Haven, UT | 1.0–3.0 | 1.0–2.0 | 975 | $1,772 | $1.82 | 15d | 15 | 1.11mi |
| 4499 S 1930 W Roy, UT | 1.0–3.0 | 1.0–2.5 | 1106 | $2,162 | $1.95 | 15d | 11 | 1.21mi |
HOA detail
- Monthly dues
- $769 · $9,228/yr
Listing history 2 events
-
2026-06-19remarks 255-char remark
-
2026-06-19$104,900 Active 1 DOM
ⓘ Source: listings_history table (triggers on properties + properties_extension) + one-shot
backfill from property_details.listing_events for pre-trigger history.
Climate risk First Street
- Flood 1/10 Low FEMA zone X (unshaded) · 0% chance over 30 yrs
- Wildfire 1/10 Low
- Heat 4/10 Moderate 6 d/yr ≥94°F today · 15 d/yr by 30 yrs out
- Wind 1/10 Low
- Air quality 4/10 Moderate 4 unhealthy d/yr today · 5 by 30 yrs out
Nearby sold comps map
Loading sold comps map…
Walkable amenities ~0.75 mi
Loading nearby amenities…
Taxation est. · year 1
- Rental income
- $26,597
- − Mortgage interest
- −$5,876
- − Property taxes
- −$1,574
- − Insurance
- −$524
- − Repairs & maintenance
- −$2,128
- − Management
- −$2,128
- − HOA
- −$9,228
- − Depreciation
- −$3,052
- Taxable income
- $2,087
- Est. tax owed @ 24.0%
- −$501
- After-tax cash flow
- $2,583/yr
For passive investors: Depreciation is non-cash, so a rental often shows a tax loss while cash-flowing — sheltering income. Rental losses are passive: they offset passive income freely, and up to $25,000/yr can offset ordinary (W-2) income if you actively participate and your MAGI is under $100k (phasing out to $0 by $150k); unused losses carry forward. On sale, claimed depreciation is recaptured at up to 25%, and gains may owe capital-gains tax (a 1031 exchange can defer both). Figures are a year-1 estimate at your 24.0% rate — not tax advice; consult a CPA.
Schools (NCES district)
- District
- Weber District
- NCES district ID
- 4901200
- Math proficiency
- 36% ▼ -4.00%
- Reading proficiency
- 35% ▼ -5.00%
- Median HH income
- $65,750
- Composite
- 32.28/100
- National rank
- #5757
- State rank
- #56 of 80 in UT
Livability — Roy
- Score
- 81/100
- State rank
- #32
- US rank
- #1449
Category grades
Schools grade is shown separately in the Schools card above.
Census & demographics
- Census place
- Roy, UT
- County
- Weber County · 260,557 people
- City population
- 38,794
- Metro
- Ogden-Clearfield, UT
- Population (ZIP)
- 38,794
- Household income
- $91,115
- Rent vs Own
- Severe rent burden
- 216.0
Population outlook (Weber County) Hauer SSP2
- Today (2025)
- 274,329 people
- By 2030
- 288,577 · +5.2%
- By 2040
- 314,848 · +14.8%
- By 2050
- 338,710 · +23.5%
- By 2075
- 384,412 · +40.1%
- By 2100
- 409,305 · +49.2%
Race, ethnicity, and origin ACS 2023
- Neighborhood character
- Predominantly White (73%)
- Race & ethnicity
- White 73% Hispanic / Latino 19% Two or more races 8% Asian 2%
- Hispanic origin (detail)
- Mexican 14%
- Common ancestry
- Slovak 4% Italian 4% Portuguese 3%
- Foreign-born
- 6% · Canada
- Languages at home
- 86% English-only · Spanish 11% Other Asian/Pacific 1% Tagalog/Filipino 1%
Political lean MEDSL · Weber
- 2024 margin
- Strong R (+23.5) · D 36.8% · R 60.3% · Other 2.9%
- 2008→2024 swing
- +4.1pp toward D · 2008: -27.6pp · 2024: -23.5pp
- All cycles
- 2024: R+23.5 2020: R+22.7 2016: R+20.0 2012: R+46.0 2008: R+27.6
Not yet ingested
- Civics
- —
Market trends
- HPI YoY
- ▼ -284.84%
- Current HPI
- 323.642
- Rent YoY
- ▼ -0.45%
- Metro
- Ogden-Clearfield, UT
- State GDP YoY
- ▲ 3.54%
- F500 in state
- 2
Industry mix (Fortune 500 HQ in UT)
| Industry | F500 HQs | Revenue |
|---|---|---|
| Financial Services | 1 | $3B |
|
||
Price history
+162.9% since first listed8 events — show timeline
- 2026-06-19 Listed $104,900 WFRMLS
- 2018-02-28 Sold (MLS) — WFRMLS
- 2018-02-16 Pending — WFRMLS
- 2018-01-24 Price Changed $30,000 WFRMLS
- 2018-01-24 Price Changed $35,000 WFRMLS
- 2018-01-17 Listed $40,000 WFRMLS
- 1999-03-26 Listing Removed — WFRMLS
- 1998-03-26 Listed $39,900 WFRMLS
Cash-flow waterfall
monthlySold comps — $/sqft
last 12 mo · ≤1 miLoading sold comps…