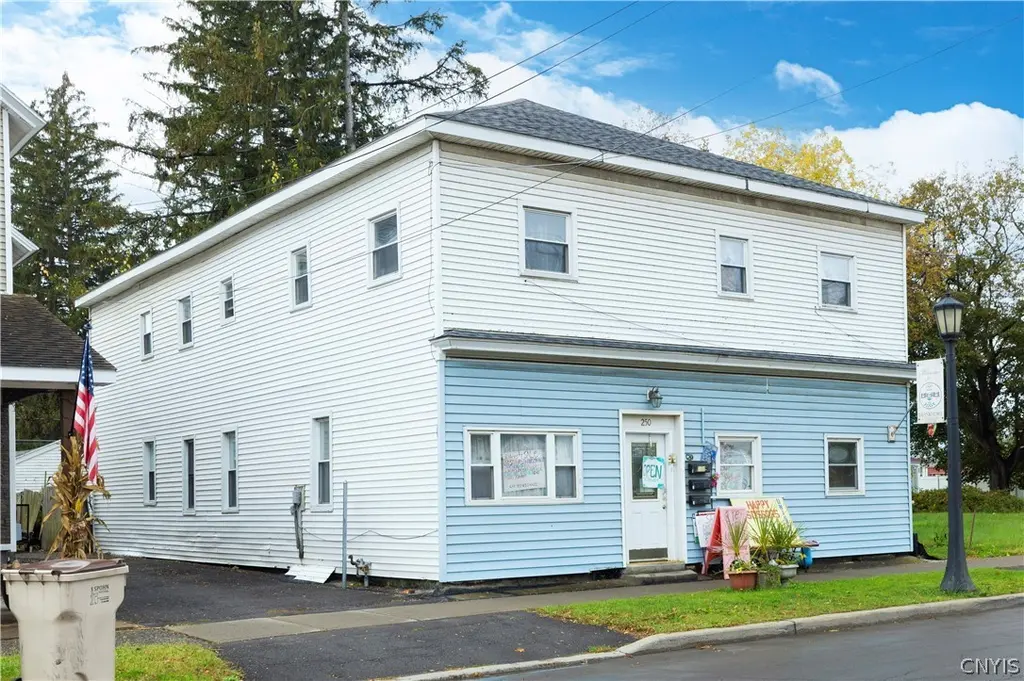
250 E Main St
Frankfort, NY 13340
$215,000B+
6 bd · 4.4 ba ·
5,445 sqft ·
Built 1900
· MultiFamily
· Active
· 53 DOM
Cashflow @ list (25.0% down · 7.5%)
Estimated rent
$3,906/mo
Mortgage (P&I)
−$1,127
Tax + insurance
−$395
HOA
−$0
Vac / Maint / Mgmt
−$820
Net cashflow
$1,563/mo
Annual
$18,754/yr
Cap rate
15.02%
Cash-on-cash
31.15%
DSCR
2.39
1% rule
1.82%
Cash to close
$60,200
Investor read
- This is a 2 × 3-bed/?-bath units multifamily listed at $215k.
- At list price, monthly cash flow is $2k ($19k/yr) — positive. Per door: $781/mo.
- The deal already cash-flows at list — no discount required.
- Meets the 1% rule at list price ($4k rent vs $215k).
- It's been on market 53 days — a 3% lower offer ($209k) is reasonable based on typical stale-listing flexibility.
- Recommended offer: $209k (3.0% below list) — sets the bar for market timing.
- In year one you build about $23k of equity ($1k loan paydown + $22k appreciation (10.0% local appreciation)).
- Location reads 66/100 on livability (#648 in NY) — a middle-class / working-renter tenant base. Strengths: cost of living A+, housing A+, crime A-; Watch: health & safety C-, amenities F, commute F.
- Frankfort-Schuyler Central School District (town): math 32% / reading 45% proficiency, ranked #538 of 590 in NY (top 91%) — families likely to look elsewhere, expect single-tenant / working-renter base with shorter leases.
- Zoned schools: Frankfort-Schuyler Elementary School (math 17% / reading 42%, grade F, #1,729 of 2,108 statewide, top 84%, 349 students, 48% FRL); Frankfort-Schuyler Middle School (math 17% / reading 52%, grade F, #483 of 729 statewide, top 68%, 210 students, 49% FRL); Frankfort-Schuyler Central High School (math 92%, 258 students, 45% FRL).
- Watch-outs: built in 1900 — expect roof / HVAC / electrical / plumbing capex.
- Market conditions: 40 active listings in the ZIP; 54 units permitted in Herkimer County in 2024 (0 in 5+ unit buildings).
- Herkimer County population projected at -24% by 2050 — secular population decline; favor cash flow + early exit over multi-decade hold.
- 3 sale attempts with the ask held roughly flat each time — persistent listings suggest the price (not the market) is what's stuck; bring a comps-based counter.
- At projected returns (10.0% appreciation + 3.0% rent growth), your $60k cash investment doubles in ~2 years — after that, you're playing with house money.
- By year 2, paydown + projected appreciation supports a ~$37k cash-out refi (75% LTV) — recoverable capital for the next deal without selling this one.
Questions for listing agent
- It's been on market 53 days. Have you received any prior offers? Is the seller open to a 3% concession, seller financing, or rate buy-down credit?
- Can we see the unit-by-unit rent roll, current vacancy, and any below-market leases? What's the average tenancy length?
- What capital expenditures (roof, boiler, parking lot, exteriors) have been made in the last 5 years, and what's planned in the next 2?
- Built in 1900 — when were the roof, HVAC, electrical panel, plumbing, and water heater last replaced?
- Is there a deadline driving the sale (1031 exchange, divorce, estate, relocation)? That informs how much negotiation room exists.
- What's the average days-on-market for RENTAL listings here right now (not sales)? A rising rental-DOM trend means longer vacancies and softer asking-rent achievability than the comps imply.
- What's the recent tenant-quality profile in this submarket — average credit score on applications, eviction rate, late-payment / NSF rate, and stable-employment percentage? A property-management company in the area should have these aggregated.
- How much new apartment / multifamily construction is in the pipeline within 1–3 miles? Heavy new supply (>2% of stock underway) typically softens rents 12–24 months out; light construction supports rent growth.
CashFlowRE · CFR-4QRGK71RWBMMT9
· Data 1 h ago
cashflowre.app · 2026-05-29