 Duplex
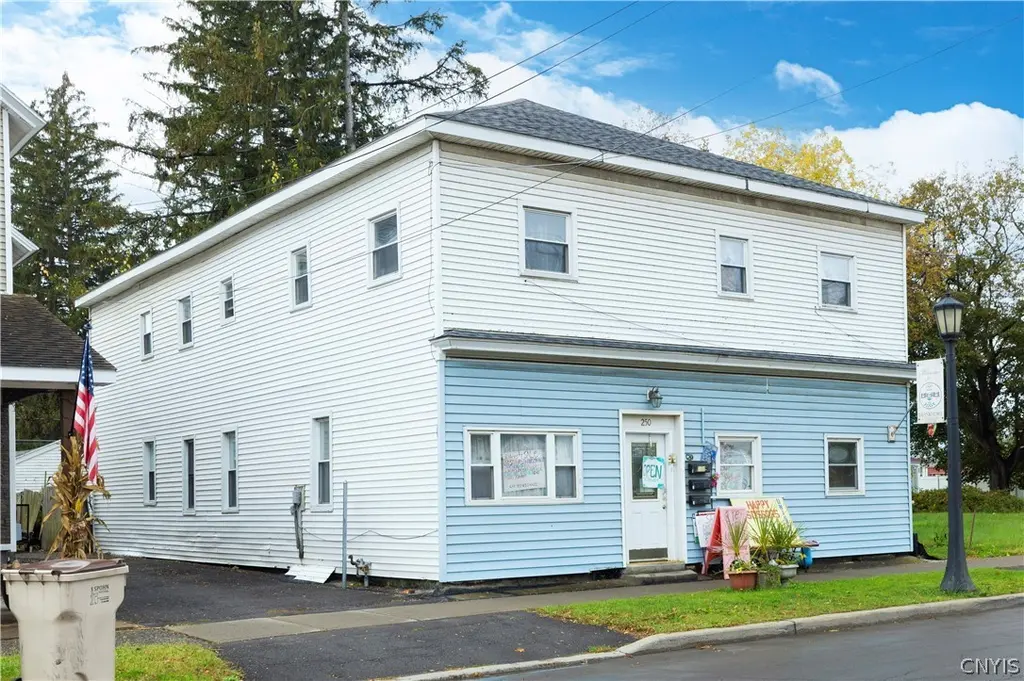
250 E Main St · Frankfort, NY
Flood risk No data
- FEMA flood zone
- —
- Chance of flooding over 30 yrs
- —
- Est. flood insurance / yr
- —
Fire risk No data
- Est. fire insurance / yr
- —
Heat risk No data
- Hot days now (above threshold)
- —
- Hot days in 30 yrs
- —
Wind risk No data
- Chance of severe wind over 30 yrs
- —
Air-quality risk No data
- Unhealthy air days now
- —
- Unhealthy air days in 30 yrs
- —
Risk factors via First Street. Map © Google.
Why this score? — see what drove the B+ grade
The composite is a weighted blend of 9 inputs, each scored 0–100. Each bar is that input's sub-score; the figure is the points it added to the 100-point composite (weight × sub-score).
- Cash flow +30.0/30.0
- 1% rule +10.0/10.0
- DSCR +10.0/10.0
- Appreciation +10.0/10.0
- ARV discount +7.5/15.0
- Schools +3.3/10.0
- Livability +3.3/5.0
- Rent growth +2.5/5.0
- Condition / age +2.5/5.0
$215,000
🖨 Deal sheet (PDF) 📄 Offer letter ✓ Due diligence
Multi-family units
County records classify this as Multi-Family (5+ Unit). Listing-text estimate: 2 units. estimate disagrees with records
5+ unit building — per-unit beds/baths from public records are typically unavailable; the breakdown below (if shown) is an estimate from the listing text.
Listing remarks
Right in the heart of the Village of Frankfort, this 5,400+ sq ft mixed-use property blends charm, income, and flexibility all in one. The building features three income-producing residential units alongside a street-level commercial storefront currently operating as a salon, drawing in steady visibility and foot traffic. Major updates give peace of mind, including a new roof (2022), a brand-new steam boiler installed this year, and a new hot water heater. Tenants enjoy ample off-street parking, plus the added bonus of a 1-car garage in the back, while customers benefit from easy street parking right out front. With commercial zoning and excellent exposure, the possibilities are wide open-p
Key facts
- New hot water heater
- 1-car garage
- Mixed-use property
Tags
Property features AI
Finance
- Other: Multi-unit property with 4 total units; 3 separate electric meters; 1 separate gas meter
- Financial info: Operating expense details available in remarks; Owner pays: see remarks; Rent includes: see remarks
Exterior
- Parking: Attached garage with 1 space; Gravel parking with two or more additional spaces
- Utilities: Public water connected; Sewer connected; Electricity connected (circuit breakers); Cable available; High-speed internet available
- Home design: 2-story building; Resale property
- Construction: Vinyl siding; Copper plumbing; Asphalt shingle roof; Full basement
- Exterior features: Rectangular lot; Frontage on a main thoroughfare
Interior
- Flooring: Carpet; Laminate; Vinyl; Varied flooring
- Bathrooms: 4 full bathrooms; 1 half bathroom
- Heating & cooling: Gas heating; Steam heating
- Interior features: Ceiling fan(s)
- Laundry & utility: Electric water heater
Neighborhood map
What this means for you Summary
Snapshot
- This is a 2 × 3-bed/?-bath units multifamily listed at $215k.
Deal economics
- At list price, monthly cash flow is $2k ($19k/yr) — positive. Per door: $781/mo.
- The deal already cash-flows at list — no discount required.
- Meets the 1% rule at list price ($4k rent vs $215k).
- Recommended offer: $209k (3.0% below list) — sets the bar for market timing.
Location & tenants
- Location reads 66/100 on livability (#648 in NY) — a middle-class / working-renter tenant base. Strengths: cost of living A+, housing A+, crime A-; Watch: health & safety C-, amenities F, commute F.
- Frankfort-Schuyler Central School District (town): math 32% / reading 45% proficiency, ranked #538 of 590 in NY (top 91%) — families likely to look elsewhere, expect single-tenant / working-renter base with shorter leases.
- Zoned schools: Frankfort-Schuyler Elementary School (math 17% / reading 42%, grade F, #1,729 of 2,108 statewide, top 84%, 349 students, 48% FRL); Frankfort-Schuyler Middle School (math 17% / reading 52%, grade F, #483 of 729 statewide, top 68%, 210 students, 49% FRL); Frankfort-Schuyler Central High School (math 92%, 258 students, 45% FRL).
- Market conditions: 40 active listings in the ZIP; 54 units permitted in Herkimer County in 2024 (0 in 5+ unit buildings).
Forward outlook
- In year one you build about $23k of equity ($1k loan paydown + $22k appreciation (10.0% local appreciation)).
- Herkimer County population projected at -24% by 2050 — secular population decline; favor cash flow + early exit over multi-decade hold.
- At projected returns (10.0% appreciation + 3.0% rent growth), your $60k cash investment doubles in ~2 years — after that, you're playing with house money.
- By year 2, paydown + projected appreciation supports a ~$37k cash-out refi (75% LTV) — recoverable capital for the next deal without selling this one.
Negotiation context
- It's been on market 51 days — a 3% lower offer ($209k) is reasonable based on typical stale-listing flexibility.
- 3 sale attempts with the ask held roughly flat each time — persistent listings suggest the price (not the market) is what's stuck; bring a comps-based counter.
Risks & watch-outs
- Watch-outs: built in 1900 — expect roof / HVAC / electrical / plumbing capex.
Questions for the listing agent
- It's been on market 51 days. Have you received any prior offers? Is the seller open to a 3% concession, seller financing, or rate buy-down credit?
- Can we see the unit-by-unit rent roll, current vacancy, and any below-market leases? What's the average tenancy length?
- What capital expenditures (roof, boiler, parking lot, exteriors) have been made in the last 5 years, and what's planned in the next 2?
- Built in 1900 — when were the roof, HVAC, electrical panel, plumbing, and water heater last replaced?
- Is there a deadline driving the sale (1031 exchange, divorce, estate, relocation)? That informs how much negotiation room exists.
- What's the average days-on-market for RENTAL listings here right now (not sales)? A rising rental-DOM trend means longer vacancies and softer asking-rent achievability than the comps imply.
- What's the recent tenant-quality profile in this submarket — average credit score on applications, eviction rate, late-payment / NSF rate, and stable-employment percentage? A property-management company in the area should have these aggregated.
- How much new apartment / multifamily construction is in the pipeline within 1–3 miles? Heavy new supply (>2% of stock underway) typically softens rents 12–24 months out; light construction supports rent growth.
Investment metrics
- 1% rule
- 1.82% ✓
- Cap rate
- 15.02%
- Cash-on-cash
- 31.15%
- DSCR
- 2.39
- GRM
- 4.6
CMA / ARV
- ARV (median comp)
- $688,180
- List price
- $215,000
- Delta
- -68.76%
- Verdict
- UNDERPRICED
- Comps
- 1 within 2.0 mi
Show comp detail 1 sale within ~0.75 mi
| Address | Dist | Beds/Ba | Sqft | Sold | Price | $/sf | Match |
|---|---|---|---|---|---|---|---|
| 203 S Frankfort St | 0.20mi | 5/— (-1) | 5,968 (+10%) | 24mo | $349,900 | $59 | 50 |
Match score weights: distance 35% · size 25% · config 20% · recency 20%. Top-matched comps best support the ARV.
Projected returns pro-forma
10.0% appreciation · 3.0% rent growth · sell at horizon
- IRR
- 48.0%
- Equity multiple
- 4.60×
- Total profit
- $216,714
- Equity at exit
- $193,689
- IRR
- 41.8%
- Equity multiple
- 10.30×
- Total profit
- $560,074
- Equity at exit
- $417,698
Cash invested: $60,200 (down + closing). Projections, not guarantees.
Landlord ↔ Tenant lean methodology
- Overall (STATE)
- 15 Strongly Tenant-Friendly
- State New York
- 15 Strongly Tenant-Friendly · D+10
- County
- — inherits STATE
- City
- — inherits STATE
ZIP-level market 13340
- Home prices YoY
- 8.1%
- Active inventory
- 40
- Price-to-rent
- 9.2×
Monthly cashflow live
- Estimated rent
- $3,906 medium interval (Pro) →
- Mortgage (P&I)
- −$1,127
- Tax from tax record
- −$306 /mo · $3,670/yr
- Insurance
- −$90
- HOA
- −$0
- Vacancy / Maint / Mgmt
- −$820
- Net cashflow
- $1,563
Break-even live
Sensitivity live
| Price | -10% $1,685 | -5% $1,624 | +0% $1,563 | +5% $1,502 | +10% $1,441 |
|---|---|---|---|---|---|
| Rent | -10% $1,254 | -5% $1,409 | +0% $1,563 | +5% $1,717 | +10% $1,871 |
| Rate | -1.0pp $1,671 | -0.5pp $1,618 | base $1,563 | +0.5pp $1,507 | +1.0pp $1,450 |
2-unit breakdown (identical units grouped — click to expand)
| Units | Beds | Baths | Est. rent |
|---|---|---|---|
| 2× units | 3 | — | $3,906 |
| #1 | 3 | — | $1,953 |
| #2 | 3 | — | $1,953 |
| Total (2 units) | $3,906 | ||
UW: 25.0% down · 7.5% · 30yr · 1.5% tax · 5.0% vac · 8.0% maint · 8.0% mgmt
Financing live
Cash to close
- Down payment
- $53,750
- Closing costs
- $6,450
- Reserves months
- —
- Total cash needed
- —
Loan-product check · same deal, 3 products live
Conventional
25% down · 7.5% · 30yr
- Down + closing
- —
- Monthly P&I
- —
- Monthly cashflow
- —
- DSCR
- —
- Eligible?
- —
Personal DTI + credit; lowest rate.
DSCR
20% down · 8.5% · 30yr
- Down + closing
- —
- Monthly P&I
- —
- Monthly cashflow
- —
- DSCR
- —
- Eligible?
- —
No personal income docs; deal must DSCR.
Hard money
10% down · 12.0% · 12mo
- Down + closing
- —
- Monthly P&I
- —
- Monthly cashflow
- —
- DSCR
- —
- Eligible?
- —
Short-term bridge; refi at stabilization.
Listing history 22 events
-
2026-06-19days on market $215,000 Active 51 DOM
-
2026-06-18days on market $215,000 Active 50 DOM
-
2026-06-17days on market $215,000 Active 49 DOM
-
2026-06-16days on market $215,000 Active 48 DOM
-
2026-06-15days on market $215,000 Active 47 DOM
-
2026-06-14days on market $215,000 Active 45 DOM
-
2026-06-13days on market $215,000 Active 44 DOM
-
2026-06-10days on market $215,000 Active 42 DOM
-
2026-06-09days on market $215,000 Active 41 DOM
-
2026-06-08days on market $215,000 Active 40 DOM
-
2026-06-07days on market $215,000 Active 39 DOM
-
2026-06-02days on market $215,000 Active 34 DOM
-
2026-06-01days on market $215,000 Active 33 DOM
-
2026-05-31days on market $215,000 Active 32 DOM
-
2026-05-30days on market $215,000 Active 31 DOM
-
2026-04-29$215,000 Active 1093-char remark
-
2025-09-24historical $950
-
2025-09-24historical
-
2025-07-30price $215,000
-
2025-07-14$950
-
2025-07-14price $225,000
-
2025-06-09$249,000 Active
ⓘ Source: listings_history table (triggers on properties + properties_extension) + one-shot
backfill from property_details.listing_events for pre-trigger history.
Tax reassessment forecast NY · Partial reset (capped growth)
- Current annual tax
- $3,670 · $306/mo
- Projected year-2 tax
- $3,670 · $306/mo
- Expected delta
- $0/yr ($0/mo · 0.0%)
ⓘ Screening estimate from a state-policy table — verify with the county assessor before closing.
Nearby sold comps map
Loading sold comps map…
Walkable amenities ~0.75 mi
Loading nearby amenities…
Taxation est. · year 1
- Rental income
- $46,872
- − Mortgage interest
- −$12,043
- − Property taxes
- −$3,670
- − Insurance
- −$1,075
- − Repairs & maintenance
- −$3,750
- − Management
- −$3,750
- − Depreciation
- −$6,255
- Taxable income
- $16,330
- Est. tax owed @ 24.0%
- −$3,919
- After-tax cash flow
- $14,835/yr
For passive investors: Depreciation is non-cash, so a rental often shows a tax loss while cash-flowing — sheltering income. Rental losses are passive: they offset passive income freely, and up to $25,000/yr can offset ordinary (W-2) income if you actively participate and your MAGI is under $100k (phasing out to $0 by $150k); unused losses carry forward. On sale, claimed depreciation is recaptured at up to 25%, and gains may owe capital-gains tax (a 1031 exchange can defer both). Figures are a year-1 estimate at your 24.0% rate — not tax advice; consult a CPA.
Schools (NCES district)
- District
- Frankfort-Schuyler Central School District
- NCES district ID
- 3611400
- Math proficiency
- 32% ▼ -12.00%
- Reading proficiency
- 45% ▲ 3.00%
- Median HH income
- $46,499
- Composite
- 32.87/100
- National rank
- #5610
- State rank
- #538 of 590 in NY
Livability — Frankfort
- Score
- 66/100
- State rank
- #648
- US rank
- #12129
Category grades
Schools grade is shown separately in the Schools card above.
Census & demographics
- Census place
- Frankfort, NY
- Population (ZIP)
- 7,322
Population outlook (Herkimer County) Hauer SSP2
- Today (2025)
- 59,340 people
- By 2030
- 56,838 · -4.2%
- By 2040
- 51,098 · -13.9%
- By 2050
- 45,080 · -24.0%
- By 2075
- 32,648 · -45.0%
- By 2100
- 22,266 · -62.5%
Race, ethnicity, and origin ACS 2023
- Neighborhood character
- Predominantly White (91%)
- Race & ethnicity
- White 91% Two or more races 4% Black 2% Hispanic / Latino 1%
- Common ancestry
- Romanian 7% Lithuanian 3% American 2%
- Foreign-born
- 8% · Canada
- Languages at home
- 90% English-only · Russian/Polish/Slavic 6% Other Indo-European 2% Spanish 1%
Political lean MEDSL · Herkimer
- 2024 margin
- Solid R (+36.4) · D 31.8% · R 68.2%
- 2008→2024 swing
- -27.1pp toward R · 2008: -9.3pp · 2024: -36.4pp
- All cycles
- 2024: R+36.4 2020: R+30.5 2016: R+34.5 2012: R+8.4 2008: R+9.3
Not yet ingested
- Civics
- —
Market trends
- HPI YoY
- ▲ 25.15%
- Current HPI
- 336.077
- Rent YoY
- —
- Metro
- —
- State GDP YoY
- ▲ 2.60%
- F500 in state
- 92
Industry mix (Fortune 500 HQ in NY)
| Industry | F500 HQs | Revenue |
|---|---|---|
| Financial Services | 10 | $950B |
|
||
| Consumer Goods | 9 | $162B |
|
||
| Insurance | 4 | $225B |
|
||
| Telecommunications | 2 | $144B |
|
||
| Pharmaceuticals | 2 | $112B |
|
||
| Media / Entertainment | 2 | $69B |
|
||
Price history
-13.7% since first listed7 events — show timeline
- 2026-04-29 Listed $215,000 CNYIS
- 2025-09-24 Rental Removed $950 CNYIS
- 2025-09-24 Listing Removed — CNYIS
- 2025-07-30 Price Changed $215,000 CNYIS
- 2025-07-14 Listed for Rent $950 CNYIS
- 2025-07-14 Price Changed $225,000 CNYIS
- 2025-06-09 Listed $249,000 CNYIS
Property tax history
+2.7%/yrLatest (2025): $3,670 · -5.3% YoY. Source: county tax records.
Cash-flow waterfall
monthlySold comps — $/sqft
last 12 mo · ≤1 miLoading sold comps…