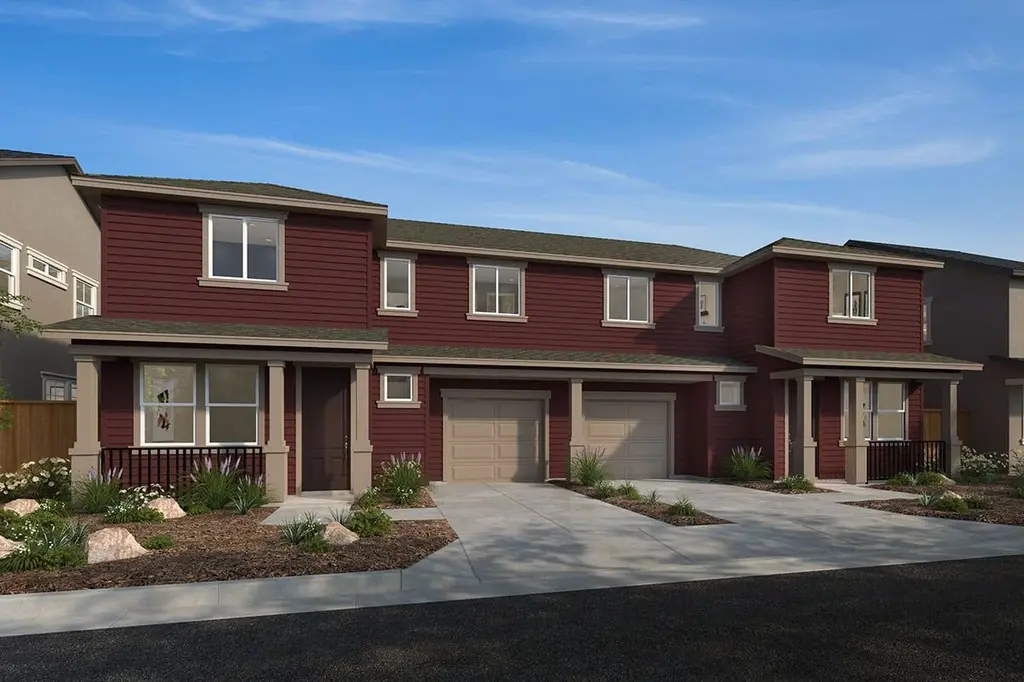
Plan 1454 Plan
Santa Rosa, CA 95404
$589,990C
3 bd · 2.5 ba ·
1,454 sqft ·
Built —
· MultiFamily
· Active
· 61 DOM
Cashflow @ list (25.0% down · 7.5%)
Estimated rent
$6,289/mo
Mortgage (P&I)
−$3,094
Tax + insurance
−$983
HOA
−$0
Vac / Maint / Mgmt
−$1,321
Net cashflow
$891/mo
Annual
$10,692/yr
Cap rate
8.11%
Cash-on-cash
6.47%
DSCR
1.29
1% rule
1.07%
Cash to close
$165,197
Investor read
- This is a 3-bed/2.5-bath multifamily listed at $590k. Condition is rated excellent.
- At list price, monthly cash flow is $891 ($11k/yr) — positive.
- The deal already cash-flows at list — no discount required.
- Meets the 1% rule at list price ($6k rent vs $590k).
- It's been on market 61 days — a 6% lower offer ($555k) is reasonable based on typical stale-listing flexibility.
- Recommended offer: $555k (6.0% below list) — sets the bar for market timing.
- Local home prices are declining (-3.0%/yr); year-one equity from $4k of loan paydown is wiped out by about $18k of value loss. Plan a longer hold.
- Location reads 75/100 on livability (#112 in CA, #3,940 nationally) — a middle-class / working-renter tenant base. Strengths: amenities A+, commute A+, employment A+; Watch: schools C-, cost of living F.
- Santa Rosa High (urban): math 31% / reading 47% proficiency, ranked #703 of 1,400 in CA (top 50%) — families likely to look elsewhere, expect single-tenant / working-renter base with shorter leases.
- Market conditions: Rents rising (+1.1%/yr); 248 active listings in the ZIP; 7 comparable units currently listed for rent nearby; rentals at typical pace (median 15d on market — plan ~3-4 weeks tenant-placement turnaround); solid renter incomes; 1,039 units permitted in Sonoma County in 2024 (185 in 5+ unit buildings).
- Sonoma County population projected at +8% by 2050 — modest demand growth; plan on rents tracking national, not racing it.
- Cap rate 8.1% vs local median 2.5% in Santa Rosa — top-decile yield for the area; either an underpriced asset or a hidden risk that comps aren't pricing in. Stress-test before assuming the spread holds.
- At $6,289/mo this rent would consume 72% of the median local household income ($105k/yr) (locally 1663% of renters already pay >50% of income on rent) — very limited rent-growth headroom before tenants either downsize or default.
Questions for listing agent
- It's been on market 61 days. Have you received any prior offers? Is the seller open to a 6% concession, seller financing, or rate buy-down credit?
- Why hasn't it sold? Are there any deal-killer items the seller is aware of (foundation, flood, title, zoning, code violations)?
- Is there a deadline driving the sale (1031 exchange, divorce, estate, relocation)? That informs how much negotiation room exists.
- What's the average days-on-market for RENTAL listings here right now (not sales)? A rising rental-DOM trend means longer vacancies and softer asking-rent achievability than the comps imply.
- What's the recent tenant-quality profile in this submarket — average credit score on applications, eviction rate, late-payment / NSF rate, and stable-employment percentage? A property-management company in the area should have these aggregated.
- How much new apartment / multifamily construction is in the pipeline within 1–3 miles? Heavy new supply (>2% of stock underway) typically softens rents 12–24 months out; light construction supports rent growth.
CashFlowRE · CFR-4TEYA15EEKKGN3
· Data 2 days ago
cashflowre.app · 2026-05-29