 🏗️ New Construction
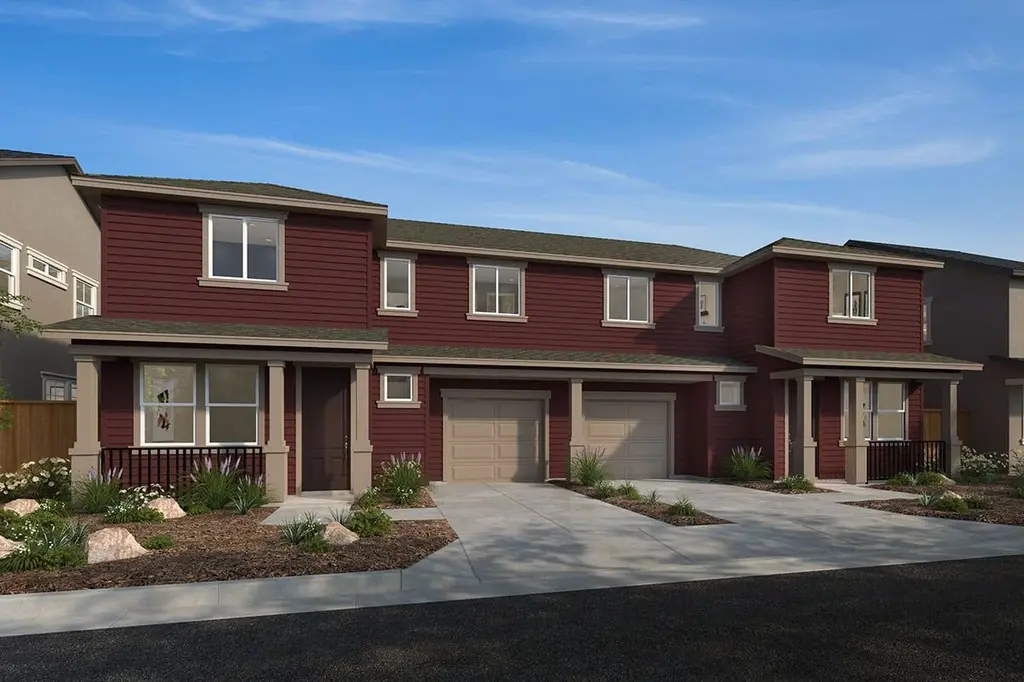
Plan 1454 Plan · Santa Rosa, CA
Flood risk No data
- FEMA flood zone
- —
- Chance of flooding over 30 yrs
- —
- Est. flood insurance / yr
- —
Fire risk No data
- Est. fire insurance / yr
- —
Heat risk No data
- Hot days now (above threshold)
- —
- Hot days in 30 yrs
- —
Wind risk No data
- Chance of severe wind over 30 yrs
- —
Air-quality risk No data
- Unhealthy air days now
- —
- Unhealthy air days in 30 yrs
- —
Risk factors via First Street. Map © Google.
Why this score? — see what drove the C grade
The composite is a weighted blend of 9 inputs, each scored 0–100. Each bar is that input's sub-score; the figure is the points it added to the 100-point composite (weight × sub-score).
- Cash flow +21.6/30.0
- ARV discount +7.5/15.0
- DSCR +6.9/10.0
- 1% rule +5.7/10.0
- Condition / age +4.8/5.0
- Livability +3.8/5.0
- Schools +3.7/10.0
- Rent growth +2.8/5.0
- Appreciation +0.0/10.0
$589,990
🖨 Deal sheet (PDF) 📄 Offer letter ✓ Due diligence
Listing remarks
* Covered front porch * Spacious living/dining area * Kitchen peninsula * Walk-in closet at primary suite * Dual-sink vanity at primary bath * Dedicated laundry area * WaterSense® labeled faucets * Low-E windows * Quartz kitchen countertops * Solar energy system * Smart thermostat * ENERGY STAR® certified home * Outdoor recreation nearby * Local wineries * Close to ocean * Near entertainment and leisure * Close to family friendly parks * Short drive to the airport
Key facts
- Covered front porch
- Low-e windows
- Kitchen peninsula
Tags
Property features AI
Finance
- Financial info: List price $629,990
Exterior
- Parking: 1-car garage; 1 total parking space
- Home design: New construction plan (Plan 1454); Single-family residence (plan)
- Construction: Built as part of 2026 plan (Plan 1454)
- Exterior features: Living area approximately 1,454 (plan)
Interior
- Kitchen: Plan includes standard kitchen (details not provided)
- Bedrooms: 3 bedrooms
- Bathrooms: 2 full bathrooms and 1 half bathroom
- Interior features: Open living area (plan)
Neighborhood map
What this means for you Summary
Snapshot
- This is a 3-bed/2.5-bath multifamily listed at $590k. Condition is rated excellent.
Deal economics
- At list price, monthly cash flow is $891 ($11k/yr) — positive.
- The deal already cash-flows at list — no discount required.
- Meets the 1% rule at list price ($6k rent vs $590k).
- Recommended offer: $555k (6.0% below list) — sets the bar for market timing.
- Cap rate 8.1% vs local median 2.5% in Santa Rosa — top-decile yield for the area; either an underpriced asset or a hidden risk that comps aren't pricing in. Stress-test before assuming the spread holds.
Location & tenants
- Location reads 75/100 on livability (#112 in CA, #3,940 nationally) — a middle-class / working-renter tenant base. Strengths: amenities A+, commute A+, employment A+; Watch: schools C-, cost of living F.
- Santa Rosa High (urban): math 31% / reading 47% proficiency, ranked #703 of 1,400 in CA (top 50%) — families likely to look elsewhere, expect single-tenant / working-renter base with shorter leases.
- Market conditions: Rents rising (+1.1%/yr); 248 active listings in the ZIP; 7 comparable units currently listed for rent nearby; rentals at typical pace (median 14d on market — plan ~3-4 weeks tenant-placement turnaround); solid renter incomes; 1,039 units permitted in Sonoma County in 2024 (185 in 5+ unit buildings).
- At $6,289/mo this rent would consume 72% of the median local household income ($105k/yr) (locally 1663% of renters already pay >50% of income on rent) — very limited rent-growth headroom before tenants either downsize or default.
Forward outlook
- Local home prices are declining (-3.0%/yr); year-one equity from $4k of loan paydown is wiped out by about $18k of value loss. Plan a longer hold.
- Sonoma County population projected at +8% by 2050 — modest demand growth; plan on rents tracking national, not racing it.
Negotiation context
- It's been on market 61 days — a 6% lower offer ($555k) is reasonable based on typical stale-listing flexibility.
Questions for the listing agent
- It's been on market 61 days. Have you received any prior offers? Is the seller open to a 6% concession, seller financing, or rate buy-down credit?
- Why hasn't it sold? Are there any deal-killer items the seller is aware of (foundation, flood, title, zoning, code violations)?
- Is there a deadline driving the sale (1031 exchange, divorce, estate, relocation)? That informs how much negotiation room exists.
- What's the average days-on-market for RENTAL listings here right now (not sales)? A rising rental-DOM trend means longer vacancies and softer asking-rent achievability than the comps imply.
- What's the recent tenant-quality profile in this submarket — average credit score on applications, eviction rate, late-payment / NSF rate, and stable-employment percentage? A property-management company in the area should have these aggregated.
- How much new apartment / multifamily construction is in the pipeline within 1–3 miles? Heavy new supply (>2% of stock underway) typically softens rents 12–24 months out; light construction supports rent growth.
Investment metrics
- 1% rule
- 1.07% ✓
- Cap rate
- 8.11%
- Cash-on-cash
- 6.47%
- DSCR
- 1.29
- GRM
- 7.8
CMA / ARV
No comps found within radius.
Projected returns pro-forma
-3.0% appreciation · 1.1% rent growth · sell at horizon
- IRR
- -8.5%
- Equity multiple
- 0.69×
- Total profit
- $-50,559
- Equity at exit
- $87,969
- IRR
- -1.7%
- Equity multiple
- 0.90×
- Total profit
- $-17,173
- Equity at exit
- $51,012
Cash invested: $165,197 (down + closing). Projections, not guarantees.
Landlord ↔ Tenant lean methodology
- Overall (STATE)
- 18 Strongly Tenant-Friendly
- State California
- 18 Strongly Tenant-Friendly · D+13
- County
- — inherits STATE
- City
- — inherits STATE
ZIP-level market 95404
- Rents YoY
- 1.1%
- Active inventory
- 248
- Price-to-rent
- 23.5×
Monthly cashflow live
- Estimated rent
- $6,289 medium interval (Pro) →
- Mortgage (P&I)
- −$3,094
- Tax est. 1.5%
- −$737 /mo · $8,850/yr
- Insurance
- −$246
- HOA
- −$0
- Vacancy / Maint / Mgmt
- −$1,321
- Net cashflow
- $891
Break-even live
Sensitivity live
| Price | -10% $1,299 | -5% $1,095 | +0% $891 | +5% $687 | +10% $483 |
|---|---|---|---|---|---|
| Rent | -10% $394 | -5% $643 | +0% $891 | +5% $1,139 | +10% $1,388 |
| Rate | -1.0pp $1,188 | -0.5pp $1,041 | base $891 | +0.5pp $738 | +1.0pp $583 |
3-unit breakdown (identical units grouped — click to expand)
| Units | Beds | Baths | Est. rent |
|---|---|---|---|
| 3× units | 2 | 1 | $6,288 |
| #1 | 2 | 1 | $2,096 |
| #2 | 2 | 1 | $2,096 |
| #3 | 2 | 1 | $2,096 |
| Total (3 units) | $6,289 | ||
UW: 25.0% down · 7.5% · 30yr · 1.5% tax · 5.0% vac · 8.0% maint · 8.0% mgmt
Financing live
Cash to close
- Down payment
- $147,498
- Closing costs
- $17,700
- Reserves months
- —
- Total cash needed
- —
Loan-product check · same deal, 3 products live
Conventional
25% down · 7.5% · 30yr
- Down + closing
- —
- Monthly P&I
- —
- Monthly cashflow
- —
- DSCR
- —
- Eligible?
- —
Personal DTI + credit; lowest rate.
DSCR
20% down · 8.5% · 30yr
- Down + closing
- —
- Monthly P&I
- —
- Monthly cashflow
- —
- DSCR
- —
- Eligible?
- —
No personal income docs; deal must DSCR.
Hard money
10% down · 12.0% · 12mo
- Down + closing
- —
- Monthly P&I
- —
- Monthly cashflow
- —
- DSCR
- —
- Eligible?
- —
Short-term bridge; refi at stabilization.
Rent comps 7 comps
| Address | Beds | Baths | Sqft | Rent | $/sqft | DOM | Units | Dist |
|---|---|---|---|---|---|---|---|---|
| 1001 Doubles Dr Unit 105 Santa Rosa, CA | 2.0 | 2.0 | 1231 | $2,895 | $2.35 | 14d | 1 | 0.24mi |
| 1001 Doubles Dr Santa Rosa, CA | 2.0 | 2.0 | 1231 | $2,750 | $2.23 | 14d | 1 | 0.24mi |
| 960 Doubles Dr Santa Rosa, CA | 2.0–3.0 | 1.0–2.5 | 1038 | $3,399 | $3.27 | 14d | 3 | 0.27mi |
| 3851 Sebastopol Rd #105 Santa Rosa, CA | 2.0 | 1.0 | 900 | $2,400 | $2.67 | 14d | 1 | 0.28mi |
| 920 Doubles Dr Santa Rosa, CA | 2.0 | 2.5 | 1013 | $2,450 | $2.42 | 14d | 1 | 0.30mi |
| 1765 W 3rd St Santa Rosa, CA | 2.0 | 1.5 | 1000 | $2,395 | $2.40 | 14d | 1 | 1.04mi |
| 1248 Sunset Ave Unit Home Santa Rosa, CA | 2.0 | 1.0 | 1150 | $2,700 | $2.35 | 24d | 1 | 1.34mi |
Listing history 16 events
-
2026-06-18days on market $589,990 Active 61 DOM
-
2026-06-17days on market $589,990 Active 60 DOM
-
2026-06-16days on market $589,990 Active 59 DOM
-
2026-06-15days on market $589,990 Active 58 DOM
-
2026-06-14days on market $589,990 Active 56 DOM
-
2026-06-13days on market $589,990 Active 55 DOM
-
2026-06-10days on market $589,990 Active 53 DOM
-
2026-06-09days on market $589,990 Active 52 DOM
-
2026-06-08days on market $589,990 Active 51 DOM
-
2026-06-07days on market $589,990 Active 50 DOM
-
2026-06-05days on market $589,990 Active 47 DOM
-
2026-06-03days on market $589,990 Active 46 DOM
-
2026-06-02days on market $589,990 Active 45 DOM
-
2026-06-01days on market $589,990 Active 44 DOM
-
2026-05-31days on market $589,990 Active 43 DOM
-
2026-05-30days on market $589,990 Active 42 DOM
ⓘ Source: listings_history table (triggers on properties + properties_extension) + one-shot
backfill from property_details.listing_events for pre-trigger history.
Nearby sold comps map
Loading sold comps map…
Walkable amenities ~0.75 mi
Loading nearby amenities…
Taxation est. · year 1
- Rental income
- $75,468
- − Mortgage interest
- −$33,049
- − Property taxes
- −$8,850
- − Insurance
- −$2,950
- − Repairs & maintenance
- −$6,037
- − Management
- −$6,037
- − Depreciation
- −$17,163
- Taxable income
- $1,381
- Est. tax owed @ 24.0%
- −$332
- After-tax cash flow
- $10,361/yr
For passive investors: Depreciation is non-cash, so a rental often shows a tax loss while cash-flowing — sheltering income. Rental losses are passive: they offset passive income freely, and up to $25,000/yr can offset ordinary (W-2) income if you actively participate and your MAGI is under $100k (phasing out to $0 by $150k); unused losses carry forward. On sale, claimed depreciation is recaptured at up to 25%, and gains may owe capital-gains tax (a 1031 exchange can defer both). Figures are a year-1 estimate at your 24.0% rate — not tax advice; consult a CPA.
Condition & rehab AI · 5 photos
This multi-family property is in excellent condition with no visible repairs needed. It offers modern amenities and a well-maintained exterior, making it an attractive investment for both resale and rental.
Value-add opportunities
- Both Smart home automation system — Enhances convenience and energy efficiency
- Both Smart security system — Improves safety and property value
- Both Smart lighting system — Enhances energy efficiency and ambiance
Renovation cost estimate screening
Value-add ROI direction
- Both Smart home automation system — Enhances convenience and energy efficiency ↑
- Both Smart security system — Improves safety and property value ↑
- Both Smart lighting system — Enhances energy efficiency and ambiance ↑
ⓘ Cost ranges are severity-bucket heuristics (US national rule-of-thumb). Get contractor quotes + a written scope before underwriting a rehab budget.
Schools (NCES district)
- District
- Santa Rosa High
- NCES district ID
- 0635830
- Math proficiency
- 31% —
- Reading proficiency
- 47% —
- Median HH income
- $62,000
- Composite
- 37.25/100
- National rank
- #8972
- State rank
- #703 of 1400 in CA
Livability — Santa Rosa
- Score
- 75/100
- State rank
- #112
- US rank
- #3940
Category grades
Schools grade is shown separately in the Schools card above.
Census & demographics
- Census place
- Santa Rosa, CA
- County
- Sonoma County · 449,805 people
- City population
- 210,074
- Metro
- Santa Rosa-Petaluma, CA
- Population (ZIP)
- 37,011
- Household income
- $105,437
- Rent vs Own
- Severe rent burden
- 1663.0
Population outlook (Sonoma County) Hauer SSP2
- Today (2025)
- 539,935 people
- By 2030
- 554,870 · +2.8%
- By 2040
- 573,262 · +6.2%
- By 2050
- 580,715 · +7.6%
- By 2075
- 579,229 · +7.3%
- By 2100
- 547,835 · +1.5%
Race, ethnicity, and origin ACS 2023
- Neighborhood character
- Diverse neighborhood (Simpson 0.56)
- Race & ethnicity
- White 61% Hispanic / Latino 25% Two or more races 13% Asian 7% Black 2%
- Hispanic origin (detail)
- Mexican 21%
- Common ancestry
- Lithuanian 4% Italian 4% Slovak 3%
- Foreign-born
- 14% · Canada, China
- Languages at home
- 76% English-only · Spanish 16% Other Asian/Pacific 2% Tagalog/Filipino 2%
Political lean MEDSL · Sonoma
- 2024 margin
- Solid D (+46.2) · D 71.4% · R 25.2% · Other 3.3%
- 2008→2024 swing
- -3.4pp toward R · 2008: 49.6pp · 2024: 46.2pp
- All cycles
- 2024: D+46.2 2020: D+51.5 2016: D+47.9 2012: D+44.9 2008: D+49.6
Not yet ingested
- Civics
- —
Market trends
- HPI YoY
- ▼ -797.65%
- Current HPI
- 244.7593
- Rent YoY
- ▲ 1.10%
- Metro
- Santa Rosa-Petaluma, CA
- State GDP YoY
- ▲ 3.21%
- F500 in state
- 116
Industry mix (Fortune 500 HQ in CA)
| Industry | F500 HQs | Revenue |
|---|---|---|
| Technology | 27 | $1,492B |
|
||
| Financial Services | 3 | $174B |
|
||
| Retail | 3 | $44B |
|
||
| Insurance | 3 | $26B |
|
||
| Media / Entertainment | 2 | $115B |
|
||
| Pharmaceuticals / Biotech | 2 | $62B |
|
||
Cash-flow waterfall
monthlySold comps — $/sqft
last 12 mo · ≤1 miLoading sold comps…