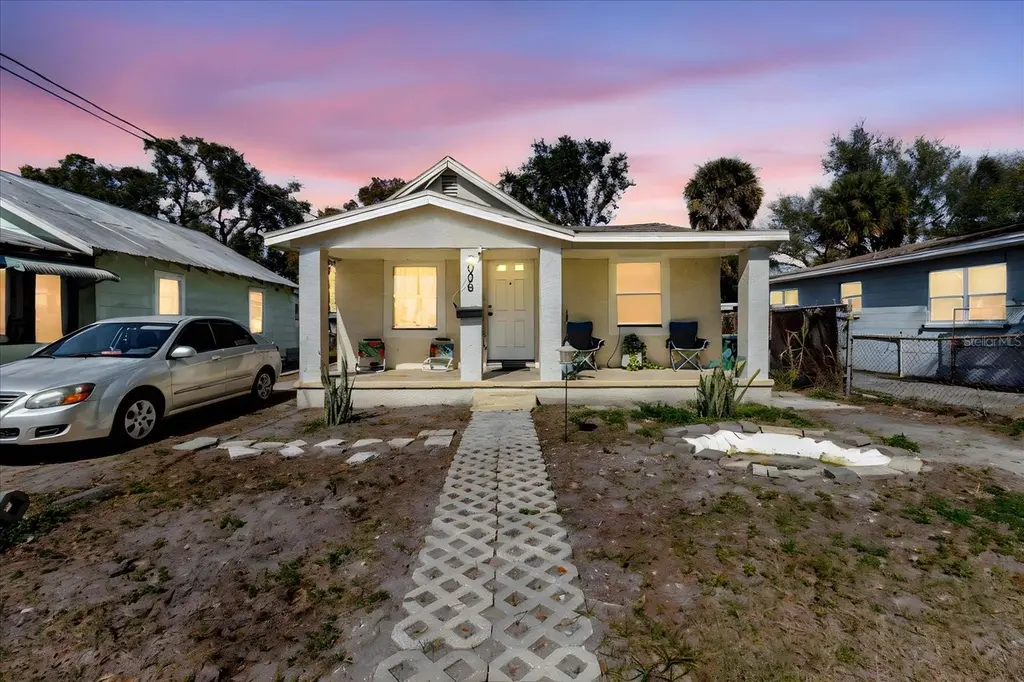
2006 Stuart St
Tampa, FL 33605
$249,900C+
2 bd · 1.0 ba ·
1,248 sqft ·
Built 1939
· SingleFamily
· Active
· 128 DOM
Cashflow @ list (25.0% down · 7.5%)
Estimated rent
$2,476/mo
Mortgage (P&I)
−$1,311
Tax + insurance
−$731
HOA
−$0
Vac / Maint / Mgmt
−$520
Net cashflow
$-85/mo
Annual
$-1,020/yr
Cap rate
7.93%
Cash-on-cash
5.86%
DSCR
1.26
1% rule
0.99%
Cash to close
$69,972
Investor read
- This is a 2-bed/1.0-bath single-family listed at $250k.
- At list price, monthly cash flow is $-85 ($-1k/yr) — negative.
- To cash-flow at today's rent, offer at most $235k (6.0% below list).
- To meet the 1% rule (rent ≥ 1% of price), the offer needs to be $248k (0.9% below list).
- It's been on market 128 days — a 12% lower offer ($220k) is reasonable based on typical stale-listing flexibility.
- Recommended offer: $220k (12.0% below list) — sets the bar for market timing.
- In year one you build about $27k of equity ($2k loan paydown + $25k appreciation (10.0% local appreciation)).
- Location reads 79/100 on livability (#142 in FL, #2,135 nationally) — a middle-class / working-renter tenant base. Strengths: commute A+, housing A+, health & safety A+; Watch: schools C-, crime D+.
- Hillsborough (suburban): math 47% / reading 50% proficiency, ranked #41 of 73 in FL (top 56%) — families likely to look elsewhere, expect single-tenant / working-renter base with shorter leases.
- Watch-outs: flood insurance adds $427/mo; built in 1939 — expect roof / HVAC / electrical / plumbing capex.
- Market conditions: Rents flat; 187 active listings in the ZIP; 40 comparable units currently listed for rent nearby; rentals at typical pace (median 18d on market — plan ~3-4 weeks tenant-placement turnaround); lower-income renter base — watch delinquency; 9,053 units permitted in Hillsborough County in 2024 (4,555 in 5+ unit buildings).
- Hillsborough County population projected at +37% by 2050 — long-run rental-demand tailwind backs the buy-and-hold thesis.
- 2 sale attempts since 5y ago with the ask held roughly flat each time — persistent listings suggest the price (not the market) is what's stuck; bring a comps-based counter.
- Current owner paid $12k; list at $250k implies a 1982% gain — meaningful room to come down on a strong offer.
- By year 2, paydown + projected appreciation supports a ~$43k cash-out refi (75% LTV) — recoverable capital for the next deal without selling this one.
- Climate carrying-cost: in FEMA flood zone AE (mandatory federal flood insurance); severe wind risk, 99% chance of damaging wind over 30y; extreme-heat days projected 7→28/yr by 2055 (HVAC capex compounding) — expect insurance premiums to compound above CPI over the hold.
- At $2,476/mo this rent would consume 80% of the median local household income ($37k/yr) (locally 1374% of renters already pay >50% of income on rent) — very limited rent-growth headroom before tenants either downsize or default.
Questions for listing agent
- What do current leases actually rent for vs. the listed asking? Can we see a recent rent roll and the last 12 months of T-12 income?
- It's been on market 128 days. Have you received any prior offers? Is the seller open to a 12% concession, seller financing, or rate buy-down credit?
- Built in 1939 — when were the roof, HVAC, electrical panel, plumbing, and water heater last replaced?
- What's the actual annual flood-insurance premium (NFIP or private), and is the property in a SFHA with mandatory coverage?
- Why hasn't it sold? Are there any deal-killer items the seller is aware of (foundation, flood, title, zoning, code violations)?
- Is there a deadline driving the sale (1031 exchange, divorce, estate, relocation)? That informs how much negotiation room exists.
- Crime grade is D in this area — have there been break-ins, vandalism, or insurance claims at this property in the last 3 years? What carrier currently insures it and at what premium?
- What's the average days-on-market for RENTAL listings here right now (not sales)? A rising rental-DOM trend means longer vacancies and softer asking-rent achievability than the comps imply.
CashFlowRE · CFR-4WH44R8X19TCRB
· Data 2 days ago
cashflowre.app · 2026-05-29