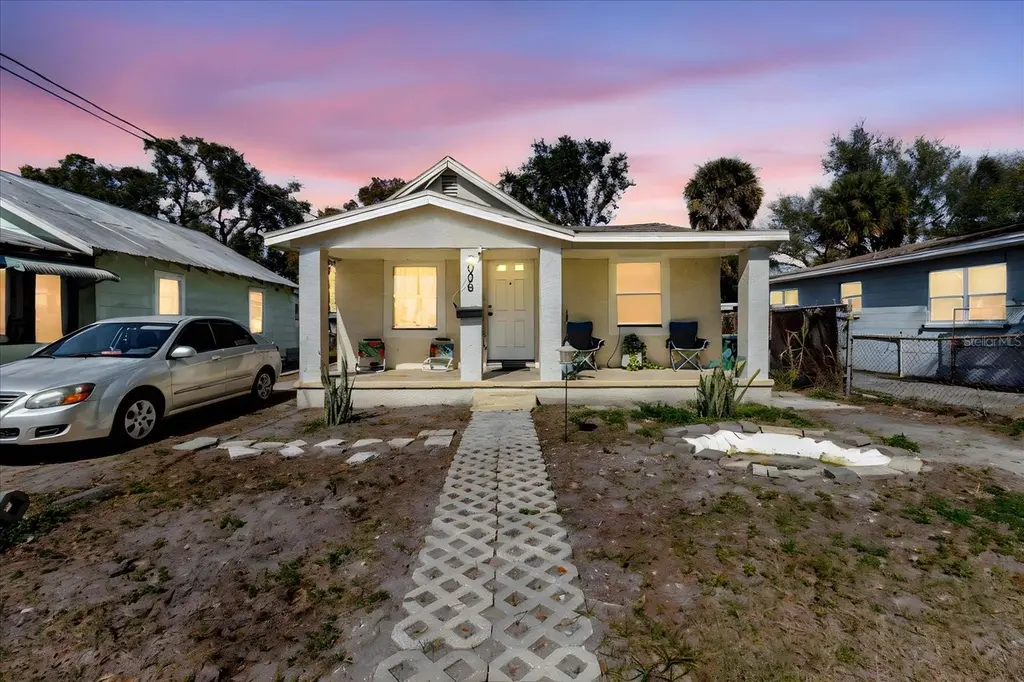
2006 Stuart St · Tampa, FL
Flood risk 9/10 · Severe
- FEMA flood zone
- AE
- Chance of flooding over 30 yrs
- 0.99%
- Est. flood insurance / yr
- $1,737 – $8,500
Fire risk 1/10 · Minimal
- Est. fire insurance / yr
- $947 – $1,759
Heat risk 10/10 · Severe
- Hot days now (above 107°F)
- 7 days/yr
- Hot days in 30 yrs
- 28 days/yr
Wind risk 9/10 · Severe
- Chance of severe wind over 30 yrs
- 99.0%
Air-quality risk 3/10 · Minor
- Unhealthy air days now
- 3 days/yr
- Unhealthy air days in 30 yrs
- 4 days/yr
Risk factors via First Street. Map © Google.
Why this score? — see what drove the C+ grade
The composite is a weighted blend of 9 inputs, each scored 0–100. Each bar is that input's sub-score; the figure is the points it added to the 100-point composite (weight × sub-score).
- Cash flow +20.8/30.0
- Appreciation +10.0/10.0
- ARV discount +7.5/15.0
- DSCR +6.6/10.0
- 1% rule +4.9/10.0
- Schools +4.2/10.0
- Livability +4.0/5.0
- Rent growth +2.6/5.0
- Condition / age +2.5/5.0
$249,900
🖨 Deal sheet 📄 Offer letter ✓ Due diligence
Listing remarks MLS
Finally is vacant and Freshly painted and move-in ready!! Calling all First-time homebuyers and those starting a new chapter!!! OR why not savvy investors!Your opportunity is here!! Don't miss the chance to own this cozy and comfortable home featuring 3 bedrooms, 2 bathrooms and 1,248 sq ft of living space. This incredible price is rarely seen in today's market, making it the perfect place to begin investing in your future. Schedule your private showing today, Opportunities like this don't last. ..
Key facts
- 4,944 sq ft lot
- Built 1939
- Listed 128 days
Neighborhood map
What this means for you Summary
Snapshot
- This is a 2-bed/1.0-bath single-family listed at $250k.
Deal economics
- At list price, monthly cash flow is $-85 ($-1k/yr) — negative.
- To cash-flow at today's rent, offer at most $235k (6.0% below list).
- To meet the 1% rule (rent ≥ 1% of price), the offer needs to be $248k (0.9% below list).
- Recommended offer: $220k (12.0% below list) — sets the bar for market timing.
Location & tenants
- Location reads 79/100 on livability (#142 in FL, #2,135 nationally) — a middle-class / working-renter tenant base. Strengths: commute A+, housing A+, health & safety A+; Watch: schools C-, crime D+.
- Hillsborough (suburban): math 47% / reading 50% proficiency, ranked #41 of 73 in FL (top 56%) — families likely to look elsewhere, expect single-tenant / working-renter base with shorter leases.
- Market conditions: Rents flat; 187 active listings in the ZIP; 40 comparable units currently listed for rent nearby; rentals at typical pace (median 18d on market — plan ~3-4 weeks tenant-placement turnaround); lower-income renter base — watch delinquency; 9,053 units permitted in Hillsborough County in 2024 (4,555 in 5+ unit buildings).
- At $2,476/mo this rent would consume 80% of the median local household income ($37k/yr) (locally 1374% of renters already pay >50% of income on rent) — very limited rent-growth headroom before tenants either downsize or default.
Forward outlook
- In year one you build about $27k of equity ($2k loan paydown + $25k appreciation (10.0% local appreciation)).
- Hillsborough County population projected at +37% by 2050 — long-run rental-demand tailwind backs the buy-and-hold thesis.
- By year 2, paydown + projected appreciation supports a ~$43k cash-out refi (75% LTV) — recoverable capital for the next deal without selling this one.
Negotiation context
- It's been on market 128 days — a 12% lower offer ($220k) is reasonable based on typical stale-listing flexibility.
- 2 sale attempts since 5y ago with the ask held roughly flat each time — persistent listings suggest the price (not the market) is what's stuck; bring a comps-based counter.
- Current owner paid $12k; list at $250k implies a 1982% gain — meaningful room to come down on a strong offer.
Risks & watch-outs
- Watch-outs: flood insurance adds $427/mo; built in 1939 — expect roof / HVAC / electrical / plumbing capex.
- Climate carrying-cost: in FEMA flood zone AE (mandatory federal flood insurance); severe wind risk, 99% chance of damaging wind over 30y; extreme-heat days projected 7→28/yr by 2055 (HVAC capex compounding) — expect insurance premiums to compound above CPI over the hold.
Questions for the listing agent
- What do current leases actually rent for vs. the listed asking? Can we see a recent rent roll and the last 12 months of T-12 income?
- It's been on market 128 days. Have you received any prior offers? Is the seller open to a 12% concession, seller financing, or rate buy-down credit?
- Built in 1939 — when were the roof, HVAC, electrical panel, plumbing, and water heater last replaced?
- What's the actual annual flood-insurance premium (NFIP or private), and is the property in a SFHA with mandatory coverage?
- Why hasn't it sold? Are there any deal-killer items the seller is aware of (foundation, flood, title, zoning, code violations)?
- Is there a deadline driving the sale (1031 exchange, divorce, estate, relocation)? That informs how much negotiation room exists.
- Crime grade is D in this area — have there been break-ins, vandalism, or insurance claims at this property in the last 3 years? What carrier currently insures it and at what premium?
- What's the average days-on-market for RENTAL listings here right now (not sales)? A rising rental-DOM trend means longer vacancies and softer asking-rent achievability than the comps imply.
- What's the recent tenant-quality profile in this submarket — average credit score on applications, eviction rate, late-payment / NSF rate, and stable-employment percentage? A property-management company in the area should have these aggregated.
- How much new for-sale + rental construction is in the pipeline within 1–3 miles? Heavy new supply typically softens prices + rents 12–24 months out; constrained supply supports both.
Investment metrics
- 1% rule
- 0.99% ✗
- Cap rate
- 7.93%
- Cash-on-cash
- 5.86%
- DSCR
- 1.26
- GRM
- 8.4
CMA / ARV
No comps found within radius.
Projected returns pro-forma
10.0% appreciation · 0.58% rent growth · sell at horizon
- IRR
- 22.4%
- Equity multiple
- 2.79×
- Total profit
- $125,029
- Equity at exit
- $225,130
- IRR
- 19.4%
- Equity multiple
- 6.17×
- Total profit
- $362,104
- Equity at exit
- $485,501
Cash invested: $69,972 (down + closing). Projections, not guarantees.
Landlord ↔ Tenant lean methodology
- Overall (STATE)
- 87 Strongly Landlord-Friendly
- State Florida
- 87 Strongly Landlord-Friendly · R+3
- County
- — inherits STATE
- City
- — inherits STATE
ZIP-level market 33605
- Home prices YoY
- 3.7%
- Rents YoY
- 0.6%
- Active inventory
- 187
- Price-to-rent
- 8.4×
Monthly cashflow live
- Estimated rent
- $2,476 high interval (Pro) →
- Mortgage (P&I)
- −$1,311
- Tax from tax record
- −$200 /mo · $2,400/yr
- Insurance
- −$104
- Flood insurance flood zone
- −$427 /mo · $5,118/yr
- HOA
- −$0
- Vacancy / Maint / Mgmt
- −$520
- Net cashflow
- $-85
Break-even live
UW: 25.0% down · 7.5% · 30yr · 1.5% tax · 5.0% vac · 8.0% maint · 8.0% mgmt
Financing live
Cash to close
- Down payment
- $62,475
- Closing costs
- $7,497
- Reserves months
- —
- Total cash needed
- —
Loan-product check · same deal, 3 products live
Conventional
25% down · 7.5% · 30yr
- Down + closing
- —
- Monthly P&I
- —
- Monthly cashflow
- —
- DSCR
- —
- Eligible?
- —
Personal DTI + credit; lowest rate.
DSCR
20% down · 8.5% · 30yr
- Down + closing
- —
- Monthly P&I
- —
- Monthly cashflow
- —
- DSCR
- —
- Eligible?
- —
No personal income docs; deal must DSCR.
Hard money
10% down · 12.0% · 12mo
- Down + closing
- —
- Monthly P&I
- —
- Monthly cashflow
- —
- DSCR
- —
- Eligible?
- —
Short-term bridge; refi at stabilization.
Rent comps 40 comps
| Address | Beds | Baths | Sqft | Rent | $/sqft | DOM | Units | Dist |
|---|---|---|---|---|---|---|---|---|
| 2019 Corrine St Tampa, FL | 2.0 | 1.0 | 900 | $1,695 | $1.88 | 24d | 1 | 0.12mi |
| 2401 Gordon St Unit 1271941P Tampa, FL | 2.0 | 1.0 | 914 | $2,906 | $3.18 | 4d | 1 | 0.26mi |
| 2401 Gordon St Unit 1271931P Tampa, FL | 2.0 | 1.0 | 914 | $2,820 | $3.09 | 24d | 1 | 0.26mi |
| 2406 E Clark St Unit B Tampa, FL | 1.0 | 1.0 | 785 | $1,325 | $1.69 | 24d | 1 | 0.29mi |
| 2406 E Clark St Unit B Tampa, FL | 1.0 | 1.0 | 785 | $1,325 | $1.69 | 21d | 1 | 0.29mi |
| 2406 E Clark St Unit A Tampa, FL | 1.0 | 1.0 | 785 | $1,325 | $1.69 | 11d | 1 | 0.29mi |
| 701 S 26th St Unit A Tampa, FL | 1.0 | 1.0 | 882 | $1,600 | $1.81 | 24d | 1 | 0.32mi |
| 2403 Durham St Tampa, FL | 2.0 | 1.0 | 702 | $1,195 | $1.70 | 3d | 1 | 0.33mi |
| 2403 Durham St Unit 1 Tampa, FL | 1.0 | 1.0 | 702 | $1,195 | $1.70 | 14d | 1 | 0.33mi |
| 2608 Durham St Unit B Tampa, FL | 3.0 | 1.0 | 848 | $1,600 | $1.89 | 24d | 1 | 0.45mi |
| 2610 Durham St Tampa, FL | 1.0 | 1.0 | 701 | $1,250 | $1.78 | 20d | 1 | 0.46mi |
| 2610 Durham St Apt B Tampa, FL | 1.0 | 1.0 | 701 | $1,250 | $1.78 | 24d | 1 | 0.46mi |
| 2610 Durham St Apt B Tampa, FL | 2.0 | 1.0 | 1088 | $1,250 | $1.15 | 14d | 1 | 0.46mi |
| 111 N 12th St Tampa, FL | 1.0–2.0 | 1.0–2.0 | 877 | $3,500 | $3.99 | 24d | 2 | 0.65mi |
| 1212 E Whiting St Unit A Tampa, FL | 2.0 | 2.0 | 1427 | $6,500 | $4.56 | 24d | 1 | 0.69mi |
| 2409 E 2nd Ave Tampa, FL | 2.0 | 1.0–2.0 | 882 | $3,549 | $4.02 | 2d | 23 | 0.70mi |
| 1209 E Cumberland Ave #2103 Tampa, FL | 2.0 | 2.5 | 1338 | $5,500 | $4.11 | 17d | 1 | 0.74mi |
| 1209 E Cumberland Ave Tampa, FL | 1.0–2.0 | 1.5–2.5 | 1317 | $5,500 | $4.17 | 21d | 3 | 0.74mi |
| 101 N Meridian Ave Tampa, FL | 2.0 | 1.0–2.5 | 935 | $4,930 | $5.27 | 1d | 38 | 0.75mi |
| 1190 E Washington St Tampa, FL | 2.0 | 1.0–2.0 | 967 | $3,346 | $3.46 | 1d | 11 | 0.75mi |
| 1208 E Kennedy Blvd #616 Tampa, FL | 2.0 | 1.0 | 1050 | $2,600 | $2.48 | 24d | 1 | 0.76mi |
| 1208 E Kennedy Blvd #515 Tampa, FL | 2.0 | 1.0 | 1050 | $2,850 | $2.71 | 4d | 1 | 0.76mi |
| 601 N 12th St Tampa, FL | 2.0 | 1.0–2.0 | 954 | $4,996 | $5.24 | 2d | 22 | 0.77mi |
| 1817 E 4th Ave Tampa, FL | 2.0 | 1.0 | 900 | $2,400 | $2.67 | 4d | 1 | 0.77mi |
| 1120 E Kennedy Blvd #515 Tampa, FL | 2.0 | 1.0 | 1050 | $2,750 | $2.62 | 24d | 1 | 0.77mi |
| 1120 E Kennedy Blvd #314 Tampa, FL | 2.0 | 1.0 | 1050 | $2,395 | $2.28 | 15d | 1 | 0.77mi |
| 1120 E Kennedy Blvd #926 Tampa, FL | 2.0 | 1.0 | 1050 | $3,100 | $2.95 | 24d | 1 | 0.77mi |
| 2006 E 4th Ave Tampa, FL | 2.0 | 2.0 | 1140 | $2,000 | $1.75 | 14d | 1 | 0.78mi |
| 617 N 12th St Unit 1312524P Tampa, FL | 1.0 | 1.0 | 796 | $4,027 | $5.06 | 13d | 1 | 0.79mi |
| 617 N 12th St Unit 1312555P Tampa, FL | 2.0 | 1.0–2.0 | 995 | $6,615 | $6.65 | 3d | 2 | 0.79mi |
| 1120 E Twiggs St Tampa, FL | 1.0–3.0 | 1.0–2.0 | 1134 | $2,702 | $2.38 | 1d | 29 | 0.82mi |
| 2002 E 5th Ave Tampa, FL | 2.0 | 2.0 | 1064 | $1,795 | $1.69 | 4d | 1 | 0.83mi |
| 1510 N 17th St Unit 1C Tampa, FL | 2.0 | 2.0 | 795 | $1,900 | $2.39 | 24d | 1 | 0.83mi |
| 702 Coral Reef Dr Tampa, FL | 1.0 | 1.0 | 1084 | $3,195 | $2.95 | 24d | 1 | 0.85mi |
| 1011 E Cumberland Ave Tampa, FL | 3.0 | 1.0–3.0 | 1043 | $5,491 | $5.26 | 2d | 28 | 0.87mi |
| E 2nd Ave Tampa, FL | 2.0 | 2.0 | 1108 | $4,515 | $4.07 | 24d | 2 | 0.89mi |
| 815 Water St Tampa, FL | 1.0–3.0 | 1.0–3.5 | 1299 | $8,020 | $6.17 | 1d | 39 | 0.90mi |
| 1050 Water St Tampa, FL | 2.0 | 1.0–2.0 | 855 | $5,864 | $6.85 | 1d | 43 | 0.93mi |
| 609 Island Place Way Unit 609 Tampa, FL | 1.0 | 1.0 | 1023 | $2,950 | $2.88 | 24d | 1 | 0.94mi |
| 604 Seascape Way Tampa, FL | 1.0 | 1.0 | 1062 | $2,950 | $2.78 | 24d | 1 | 0.95mi |
Listing history 19 events
-
2026-06-18days on market $249,900 Active 128 DOM
-
2026-06-17days on market $249,900 Active 127 DOM
-
2026-06-16days on market $249,900 Active 126 DOM
-
2026-06-15days on market $249,900 Active 125 DOM
-
2026-06-13days on market $249,900 Active 123 DOM
-
2026-06-13days on market $249,900 Active 122 DOM
-
2026-06-09days on market $249,900 Active 119 DOM
-
2026-06-08days on market $249,900 Active 118 DOM
-
2026-06-07days on market $249,900 Active 117 DOM
-
2026-06-04days on market $249,900 Active 114 DOM
-
2026-06-03days on market $249,900 Active 113 DOM
-
2026-06-02days on market $249,900 Active 112 DOM
-
2026-06-01days on market $249,900 Active 111 DOM
-
2026-05-31days on market $249,900 Active 110 DOM
-
2026-02-10$249,900 Active 505-char remark
Show marketing remark (505 chars)
Finally is vacant and Freshly painted and move-in ready!! Calling all First-time homebuyers and those starting a new chapter!!! OR why not savvy investors!Your opportunity is here!! Don't miss the chance to own this cozy and comfortable home featuring 3 bedrooms, 2 bathrooms and 1,248 sq ft of living space. This incredible price is rarely seen in today's market, making it the perfect place to begin investing in your future. Schedule your private showing today, Opportunities like this don't last. ..
-
2021-09-06historical
-
2021-08-17status Pending
-
2021-08-07$185,000 Active
-
1995-12-18soldstatus $12,000
ⓘ Source: listings_history table (triggers on properties + properties_extension) + one-shot
backfill from property_details.listing_events for pre-trigger history.
Tax reassessment forecast FL · Resets to sale price
- Current annual tax
- $2,400 · $200/mo
- Projected year-2 tax
- $2,400 · $200/mo
- Expected delta
- $0/yr ($0/mo · 0.0%)
ⓘ Screening estimate from a state-policy table — verify with the county assessor before closing.
Climate risk First Street
- Flood 9/10 Extreme FEMA zone AE · 99% chance over 30 yrs
- Wildfire 1/10 Low
- Heat 10/10 Extreme 7 d/yr ≥107°F today · 28 d/yr by 30 yrs out
- Wind 9/10 Extreme 99% chance of damaging wind over 30 yrs
- Air quality 3/10 Moderate 3 unhealthy d/yr today · 4 by 30 yrs out
Nearby sold comps map
Loading sold comps map…
Walkable amenities ~0.75 mi
Loading nearby amenities…
Taxation est. · year 1
- Rental income
- $29,713
- − Mortgage interest
- −$13,998
- − Property taxes
- −$2,400
- − Insurance
- −$6,368
- − Repairs & maintenance
- −$2,377
- − Management
- −$2,377
- − Depreciation
- −$7,270
- Taxable loss
- −$5,077
- Est. tax savings @ 24.0%
- +$1,218
- After-tax cash flow
- $198/yr
For passive investors: Depreciation is non-cash, so a rental often shows a tax loss while cash-flowing — sheltering income. Rental losses are passive: they offset passive income freely, and up to $25,000/yr can offset ordinary (W-2) income if you actively participate and your MAGI is under $100k (phasing out to $0 by $150k); unused losses carry forward. On sale, claimed depreciation is recaptured at up to 25%, and gains may owe capital-gains tax (a 1031 exchange can defer both). Figures are a year-1 estimate at your 24.0% rate — not tax advice; consult a CPA.
Schools (NCES district)
- District
- Hillsborough
- NCES district ID
- 1200870
- Math proficiency
- 47% ▼ -8.00%
- Reading proficiency
- 50% ▼ -4.00%
- Median HH income
- $50,622
- Composite
- 41.6/100
- National rank
- #3435
- State rank
- #41 of 73 in FL
Livability — Tampa
- Score
- 79/100
- State rank
- #142
- US rank
- #2135
Category grades
Schools grade is shown separately in the Schools card above.
Census & demographics
- Census place
- Tampa, FL
- County
- Hillsborough County · 1,540,968 people
- City population
- 523,346
- Metro
- Tampa-St. Petersburg-Clearwater, FL
- Population (ZIP)
- 16,030
- Household income
- $36,975
- Rent vs Own
- Severe rent burden
- 1374.0
Population outlook (Hillsborough County) Hauer SSP2
- Today (2025)
- 1,607,022 people
- By 2030
- 1,733,968 · +7.9%
- By 2040
- 1,979,565 · +23.2%
- By 2050
- 2,203,427 · +37.1%
- By 2075
- 2,667,893 · +66.0%
- By 2100
- 2,891,558 · +79.9%
Race, ethnicity, and origin ACS 2023
- Neighborhood character
- Diverse neighborhood (Simpson 0.66)
- Race & ethnicity
- Black 48% Hispanic / Latino 28% Two or more races 18% White 17% Asian 1%
- Hispanic origin (detail)
- Mexican 6% Puerto Rican 8% Cuban 6% Dominican 1%
- Common ancestry
- Hispanic 2% Romanian 1% Lithuanian 1%
- Foreign-born
- 17% · Canada, Vietnam, Jamaica
- Languages at home
- 72% English-only · Spanish 24% French/Haitian/Cajun 3% Other Asian/Pacific 1%
Political lean MEDSL · Hillsborough
- 2024 margin
- Toss-up / Even · D 47.8% · R 50.9% · Other 1.3%
- 2008→2024 swing
- -10.2pp toward R · 2008: 7.1pp · 2024: -3.1pp
- All cycles
- 2024: R+3.1 2020: D+6.9 2016: D+6.8 2012: D+6.7 2008: D+7.1
Not yet ingested
- Civics
- —
Market trends
- HPI YoY
- ▲ 17.43%
- Current HPI
- 494.1871
- Rent YoY
- ▲ 0.58%
- Metro
- Tampa-St. Petersburg-Clearwater, FL
- State GDP YoY
- ▲ 3.28%
- F500 in state
- 36
Industry mix (Fortune 500 HQ in FL)
| Industry | F500 HQs | Revenue |
|---|---|---|
| Industrial Technology | 2 | $29B |
|
||
| Insurance | 2 | $17B |
|
||
| Retail | 1 | $60B |
|
||
| Technology Distribution | 1 | $58B |
|
||
| Homebuilding | 1 | $35B |
|
||
| Technology Manufacturing | 1 | $35B |
|
||
Price history
+1982.5% since first listed5 events — show timeline
- 2026-02-10 Listed $249,900 Stellar MLS as Distributed by MLS Grid
- 2021-09-06 Listing Removed — Stellar MLS as Distributed by MLS Grid
- 2021-08-17 Pending — Stellar MLS as Distributed by MLS Grid
- 2021-08-07 Listed $185,000 Stellar MLS as Distributed by MLS Grid
- 1995-12-18 Sold (Public Records) $12,000 Public Records
Property tax history
+12.2%/yrLatest (2025): $2,400 · +13.5% YoY. Source: county tax records.
Cash-flow waterfall
monthlySold comps — $/sqft
last 12 mo · ≤1 miLoading sold comps…