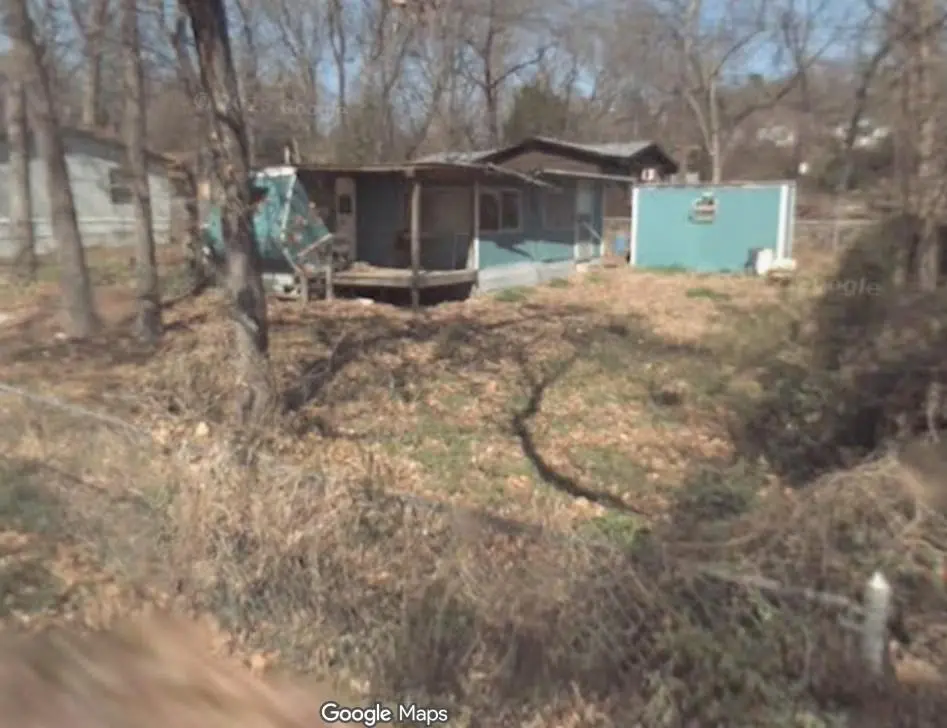
613 Turquoise Trl
Tool, TX 75143
$39,000B-
1 bd · 1.0 ba ·
2,200 sqft ·
Built 2022
· Manufactured
· Active
· 22 DOM
Cashflow @ list (25.0% down · 7.5%)
Estimated rent
$1,115/mo
Mortgage (P&I)
−$205
Tax + insurance
−$561
HOA
−$0
Vac / Maint / Mgmt
−$234
Net cashflow
$116/mo
Annual
$1,389/yr
Cap rate
22.98%
Cash-on-cash
59.60%
DSCR
3.65
1% rule
2.86%
Cash to close
$10,920
Investor read
- This is a 1-bed/1.0-bath manufactured listed at $39k.
- At list price, monthly cash flow is $116 ($1k/yr) — positive.
- The deal already cash-flows at list — no discount required.
- Meets the 1% rule at list price ($1k rent vs $39k).
- It's been on market 22 days — a 2% lower offer ($38k) is reasonable based on typical stale-listing flexibility.
- Recommended offer: $38k (1.5% below list) — sets the bar for market timing.
- Local home prices are declining (-3.0%/yr); year-one equity from $270 of loan paydown is wiped out by about $1k of value loss. Plan a longer hold.
- Location reads 66/100 on livability (#651 in TX) — a middle-class / working-renter tenant base. Strengths: crime A+, cost of living A+, housing A+; Watch: employment D, amenities F, commute F.
- Mabank ISD (town): math 47% / reading 44% proficiency, ranked #273 of 826 in TX (top 33%) — families likely to look elsewhere, expect single-tenant / working-renter base with shorter leases.
- Zoned schools: Lakeview El (math 47% / reading 47%, grade D-, #1,006 of 4,322 statewide, top 25%, 431 students, 74% FRL) — zoned schools average 74% FRL vs 54% district-wide (20 pts higher); higher-poverty schools than district average — tighter screening recommended.
- Watch-outs: property tax is 3.6% of price; flood insurance adds $427/mo.
- Market conditions: 441 active listings in the ZIP; 263 units permitted in Henderson County in 2024 (0 in 5+ unit buildings).
- At projected returns (-3.0% appreciation + 3.0% rent growth), your $11k cash investment doubles in ~9 years — after that, you're playing with house money.
- Climate carrying-cost: in FEMA flood zone AE (mandatory federal flood insurance); severe wind risk, 80% chance of damaging wind over 30y; extreme-heat days projected 7→26/yr by 2055 (HVAC capex compounding) — expect insurance premiums to compound above CPI over the hold.
- Cap rate 23.0% vs local median 2.8% in Tool — top-decile yield for the area; either an underpriced asset or a hidden risk that comps aren't pricing in. Stress-test before assuming the spread holds.
Questions for listing agent
- Property tax is high relative to price — has the assessment been appealed recently, and will the sale trigger a re-assessment?
- What's the actual annual flood-insurance premium (NFIP or private), and is the property in a SFHA with mandatory coverage?
- Is there a deadline driving the sale (1031 exchange, divorce, estate, relocation)? That informs how much negotiation room exists.
- This sits on a lake — are riparian / water-frontage rights deeded with the parcel? Any dock permits, shoreline easements, or HOA water-use restrictions?
- What's the documented flood / surge / shoreline-erosion history here (FEMA AND non-FEMA — e.g., storm surge, creek backup, septic-field saturation)?
- Any water-quality or seasonal algae-bloom issues that affect tenant satisfaction or short-term-rental demand?
- What's the average days-on-market for RENTAL listings here right now (not sales)? A rising rental-DOM trend means longer vacancies and softer asking-rent achievability than the comps imply.
- What's the recent tenant-quality profile in this submarket — average credit score on applications, eviction rate, late-payment / NSF rate, and stable-employment percentage? A property-management company in the area should have these aggregated.
CashFlowRE · CFR-4X662NCV0TMFJJ
· Data 2 days ago
cashflowre.app · 2026-05-29