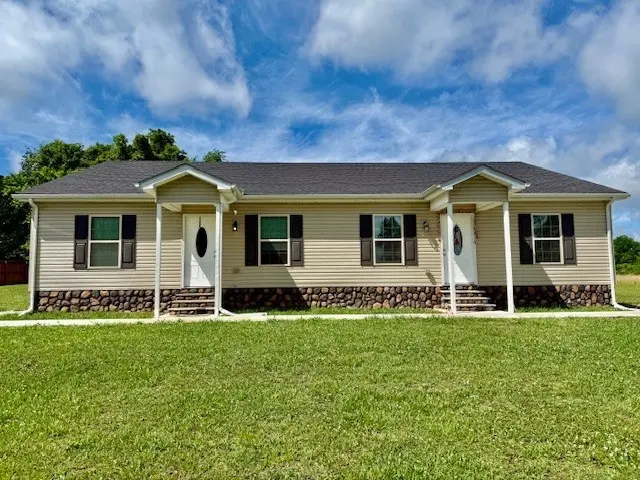
1316 Old Cowan Rd
Winchester, TN 37398
$364,900C
6 bd · 4.0 ba ·
2,052 sqft ·
Built 2022
· MultiFamily
· Active
· 29 DOM
Cashflow @ list (25.0% down · 7.5%)
Estimated rent
$4,074/mo
Mortgage (P&I)
−$1,914
Tax + insurance
−$330
HOA
−$0
Vac / Maint / Mgmt
−$856
Net cashflow
$975/mo
Annual
$11,695/yr
Cap rate
9.50%
Cash-on-cash
11.45%
DSCR
1.51
1% rule
1.12%
Cash to close
$102,172
Investor read
- This is a 2 × 3.0-bed/2.0-bath units multifamily listed at $365k. Condition is rated good.
- At list price, monthly cash flow is $975 ($12k/yr) — positive. Per door: $487/mo.
- The deal already cash-flows at list — no discount required.
- Meets the 1% rule at list price ($4k rent vs $365k).
- It's been on market 29 days — a 2% lower offer ($359k) is reasonable based on typical stale-listing flexibility.
- Recommended offer: $359k (1.5% below list) — sets the bar for market timing.
- Local home prices are declining (-3.0%/yr); year-one equity from $3k of loan paydown is wiped out by about $11k of value loss. Plan a longer hold.
- Location reads 65/100 on livability (#149 in TN) — a middle-class / working-renter tenant base. Strengths: cost of living A+, housing A+; Watch: employment C-, crime D, amenities D-.
- Franklin County (town): math 18% / reading 22% proficiency, ranked #111 of 139 in TN (top 80%) — low school quality limits family demand, transient renter base, plan for 1-2y turnover.
- Zoned schools: Clark Memorial School (math 14% / reading 27%, grade F, #637 of 952 statewide, top 68%, 489 students, 0% FRL); Franklin Co High School (math 5% / reading 22%, grade F, #255 of 332 statewide, top 77%, 1,180 students, 0% FRL) — zoned schools average 0% FRL vs 48% district-wide (48 pts lower); this property's tenant base skews higher-income than the district average.
- Market conditions: 324 active listings in the ZIP; 422 units permitted in Franklin County in 2024 (5 in 5+ unit buildings).
- Franklin County population projected at +6% by 2050 — modest demand growth; plan on rents tracking national, not racing it.
- At projected returns (-3.0% appreciation + 3.0% rent growth), your $102k cash investment doubles in ~10 years — after that, you're playing with house money.
- Cap rate 9.5% vs local median 3.0% in Winchester — top-decile yield for the area; either an underpriced asset or a hidden risk that comps aren't pricing in. Stress-test before assuming the spread holds.
Questions for listing agent
- Can we see the unit-by-unit rent roll, current vacancy, and any below-market leases? What's the average tenancy length?
- What capital expenditures (roof, boiler, parking lot, exteriors) have been made in the last 5 years, and what's planned in the next 2?
- Is there a deadline driving the sale (1031 exchange, divorce, estate, relocation)? That informs how much negotiation room exists.
- Schools are F-rated, which usually means shorter tenancies and higher turnover. Who's the typical renter profile here, and what's been the actual vacancy rate?
- Crime grade is D in this area — have there been break-ins, vandalism, or insurance claims at this property in the last 3 years? What carrier currently insures it and at what premium?
- What's the average days-on-market for RENTAL listings here right now (not sales)? A rising rental-DOM trend means longer vacancies and softer asking-rent achievability than the comps imply.
- What's the recent tenant-quality profile in this submarket — average credit score on applications, eviction rate, late-payment / NSF rate, and stable-employment percentage? A property-management company in the area should have these aggregated.
- How much new apartment / multifamily construction is in the pipeline within 1–3 miles? Heavy new supply (>2% of stock underway) typically softens rents 12–24 months out; light construction supports rent growth.
CashFlowRE · CFR-4XMQ52B9B6C00F
· Data 1 day ago
cashflowre.app · 2026-05-29