 Duplex
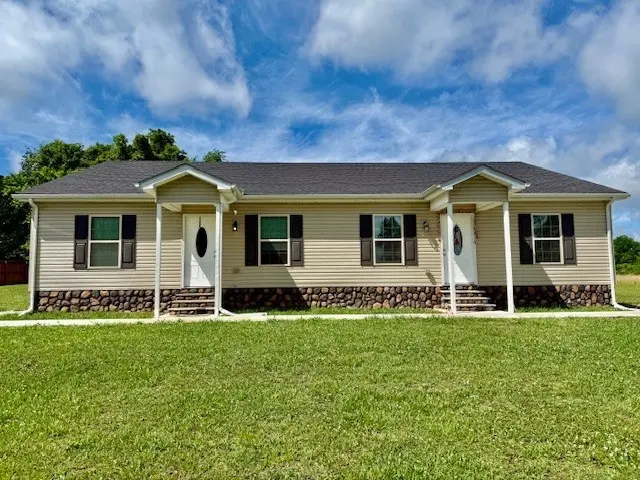
1316 Old Cowan Rd · Winchester, TN
Flood risk No data
- FEMA flood zone
- —
- Chance of flooding over 30 yrs
- —
- Est. flood insurance / yr
- —
Fire risk No data
- Est. fire insurance / yr
- —
Heat risk No data
- Hot days now (above threshold)
- —
- Hot days in 30 yrs
- —
Wind risk No data
- Chance of severe wind over 30 yrs
- —
Air-quality risk No data
- Unhealthy air days now
- —
- Unhealthy air days in 30 yrs
- —
Risk factors via First Street. Map © Google.
Why this score? — see what drove the C grade
The composite is a weighted blend of 9 inputs, each scored 0–100. Each bar is that input's sub-score; the figure is the points it added to the 100-point composite (weight × sub-score).
- Cash flow +26.6/30.0
- DSCR +9.1/10.0
- ARV discount +6.8/15.0
- 1% rule +6.2/10.0
- Condition / age +3.8/5.0
- Livability +3.2/5.0
- Rent growth +2.5/5.0
- Schools +1.7/10.0
- Appreciation +0.0/10.0
$364,900
🖨 Deal sheet 📄 Offer letter ✓ Due diligence
Multi-family units
County records classify this as Multi-Family (2-4 Unit). Listing-text estimate: 2 units. confirmed
Listing remarks
INVESTOR SPECIAL! INCLUDES 1316/1318 OLD COWAN RD! Duplex featuring 3BR/2BA units with stainless appliances, tile flooring, and city water and sewer. Strong rental potential in a convenient location just minutes from downtown Winchester. Low‑maintenance finishes and solid layout make this an excellent income‑producing opportunity for any portfolio.
Key facts
- Stainless appliances
- City water and sewer
- Tile flooring
Tags
Property features AI
Finance
- Other: Zoning: r
- Financial info: Gross income reported as $33,000; Net operating income reported as $33,000; Tenant pays electricity
Exterior
- Parking: Driveway parking; 2 total parking spaces (2 open)
- Utilities: Public water; Public sewer; Electricity available
- Home design: Residential income property; Attached duplex; One-story
- Construction: Vinyl siding; Shingle roof; Duplex structure
- Exterior features: Irregular lot dimensions approximately 122.9 x 104.99
Interior
- Bedrooms: Two 3-bedroom units (each unit is 3 bedrooms)
- Flooring: Tile
- Bathrooms: Each unit has 2 bathrooms
- Heating & cooling: Central heating (electric); Central air conditioning (electric)
- Interior features: Tile flooring
- Laundry & utility: Individual laundry hook-ups; Washer hookup; Electric dryer hookup
Neighborhood map
What this means for you Summary
Snapshot
- This is a 2 × 3.0-bed/2.0-bath units multifamily listed at $365k. Condition is rated good.
Deal economics
- At list price, monthly cash flow is $975 ($12k/yr) — positive. Per door: $487/mo.
- The deal already cash-flows at list — no discount required.
- Meets the 1% rule at list price ($4k rent vs $365k).
- Recommended offer: $359k (1.5% below list) — sets the bar for market timing.
- Cap rate 9.5% vs local median 3.0% in Winchester — top-decile yield for the area; either an underpriced asset or a hidden risk that comps aren't pricing in. Stress-test before assuming the spread holds.
Location & tenants
- Location reads 65/100 on livability (#149 in TN) — a middle-class / working-renter tenant base. Strengths: cost of living A+, housing A+; Watch: employment C-, crime D, amenities D-.
- Franklin County (town): math 18% / reading 22% proficiency, ranked #111 of 139 in TN (top 80%) — low school quality limits family demand, transient renter base, plan for 1-2y turnover.
- Zoned schools: Clark Memorial School (math 14% / reading 27%, grade F, #637 of 952 statewide, top 68%, 489 students, 0% FRL); Franklin Co High School (math 5% / reading 22%, grade F, #255 of 332 statewide, top 77%, 1,180 students, 0% FRL) — zoned schools average 0% FRL vs 48% district-wide (48 pts lower); this property's tenant base skews higher-income than the district average.
- Market conditions: 324 active listings in the ZIP; 422 units permitted in Franklin County in 2024 (5 in 5+ unit buildings).
Forward outlook
- Local home prices are declining (-3.0%/yr); year-one equity from $3k of loan paydown is wiped out by about $11k of value loss. Plan a longer hold.
- Franklin County population projected at +6% by 2050 — modest demand growth; plan on rents tracking national, not racing it.
- At projected returns (-3.0% appreciation + 3.0% rent growth), your $102k cash investment doubles in ~10 years — after that, you're playing with house money.
Negotiation context
- It's been on market 29 days — a 2% lower offer ($359k) is reasonable based on typical stale-listing flexibility.
Questions for the listing agent
- Can we see the unit-by-unit rent roll, current vacancy, and any below-market leases? What's the average tenancy length?
- What capital expenditures (roof, boiler, parking lot, exteriors) have been made in the last 5 years, and what's planned in the next 2?
- Is there a deadline driving the sale (1031 exchange, divorce, estate, relocation)? That informs how much negotiation room exists.
- Schools are F-rated, which usually means shorter tenancies and higher turnover. Who's the typical renter profile here, and what's been the actual vacancy rate?
- Crime grade is D in this area — have there been break-ins, vandalism, or insurance claims at this property in the last 3 years? What carrier currently insures it and at what premium?
- What's the average days-on-market for RENTAL listings here right now (not sales)? A rising rental-DOM trend means longer vacancies and softer asking-rent achievability than the comps imply.
- What's the recent tenant-quality profile in this submarket — average credit score on applications, eviction rate, late-payment / NSF rate, and stable-employment percentage? A property-management company in the area should have these aggregated.
- How much new apartment / multifamily construction is in the pipeline within 1–3 miles? Heavy new supply (>2% of stock underway) typically softens rents 12–24 months out; light construction supports rent growth.
Investment metrics
- 1% rule
- 1.12% ✓
- Cap rate
- 9.50%
- Cash-on-cash
- 11.45%
- DSCR
- 1.51
- GRM
- 7.5
CMA / ARV
- ARV (on-the-fly)
- $359,100
- Comps found
- 1
Show comp detail 1 sale within ~0.75 mi
| Address | Dist | Beds/Ba | Sqft | Sold | Price | $/sf | Match |
|---|---|---|---|---|---|---|---|
| 1106 Old Cowan Rd | 0.21mi | 6/4.0 | 2,052 (0%) | 8mo | $360,000 | $175 | 84 |
Match score weights: distance 35% · size 25% · config 20% · recency 20%. Top-matched comps best support the ARV.
Projected returns pro-forma
-3.0% appreciation · 3.0% rent growth · sell at horizon
- IRR
- 0.7%
- Equity multiple
- 1.03×
- Total profit
- $2,834
- Equity at exit
- $54,408
- IRR
- 10.3%
- Equity multiple
- 1.80×
- Total profit
- $81,952
- Equity at exit
- $31,550
Cash invested: $102,172 (down + closing). Projections, not guarantees.
Landlord ↔ Tenant lean methodology
- Overall (STATE)
- 87 Strongly Landlord-Friendly
- State Tennessee
- 87 Strongly Landlord-Friendly · R+13
- County
- — inherits STATE
- City
- — inherits STATE
ZIP-level market 37398
- Home prices YoY
- -21.1%
- Active inventory
- 324
- Price-to-rent
- 14.9×
Monthly cashflow live
- Estimated rent
- $4,074 medium interval (Pro) →
- Mortgage (P&I)
- −$1,914
- Tax from tax record
- −$178 /mo · $2,139/yr
- Insurance
- −$152
- HOA
- −$0
- Vacancy / Maint / Mgmt
- −$856
- Net cashflow
- $975
Break-even live
2-unit breakdown (identical units grouped — click to expand)
| Units | Beds | Baths | Est. rent |
|---|---|---|---|
| 2× units | 3.0 | 2 | $4,074 |
| #1 | 3.0 | 2 | $2,037 |
| #2 | 3.0 | 2 | $2,037 |
| Total (2 units) | $4,074 | ||
UW: 25.0% down · 7.5% · 30yr · 1.5% tax · 5.0% vac · 8.0% maint · 8.0% mgmt
Financing live
Cash to close
- Down payment
- $91,225
- Closing costs
- $10,947
- Reserves months
- —
- Total cash needed
- —
Loan-product check · same deal, 3 products live
Conventional
25% down · 7.5% · 30yr
- Down + closing
- —
- Monthly P&I
- —
- Monthly cashflow
- —
- DSCR
- —
- Eligible?
- —
Personal DTI + credit; lowest rate.
DSCR
20% down · 8.5% · 30yr
- Down + closing
- —
- Monthly P&I
- —
- Monthly cashflow
- —
- DSCR
- —
- Eligible?
- —
No personal income docs; deal must DSCR.
Hard money
10% down · 12.0% · 12mo
- Down + closing
- —
- Monthly P&I
- —
- Monthly cashflow
- —
- DSCR
- —
- Eligible?
- —
Short-term bridge; refi at stabilization.
Listing history 19 events
-
2026-06-19pricedays on market $364,900 Active 29 DOM
-
2026-06-18days on market $369,900 Active 28 DOM
-
2026-06-17days on market $369,900 Active 27 DOM
-
2026-06-16days on market $369,900 Active 26 DOM
-
2026-06-15days on market $369,900 Active 25 DOM
-
2026-06-14days on market $369,900 Active 23 DOM
-
2026-06-13days on market $369,900 Active 22 DOM
-
2026-06-10days on market $369,900 Active 20 DOM
-
2026-06-09days on market $369,900 Active 19 DOM
-
2026-06-08days on market $369,900 Active 18 DOM
-
2026-06-07days on market $369,900 Active 17 DOM
-
2026-06-05days on market $369,900 Active 14 DOM
-
2026-06-03days on market $369,900 Active 13 DOM
-
2026-06-02days on market $369,900 Active 12 DOM
-
2026-06-01days on market $369,900 Active 11 DOM
-
2026-05-31days on market $369,900 Active 10 DOM
-
2026-05-30days on market $369,900 Active 9 DOM
-
2026-05-21$369,900 Active
-
2023-05-02soldstatus $345,000
ⓘ Source: listings_history table (triggers on properties + properties_extension) + one-shot
backfill from property_details.listing_events for pre-trigger history.
Tax reassessment forecast TN · Resets to sale price
- Current annual tax
- $2,139 · $178/mo
- Projected year-2 tax
- $2,591 · $216/mo
- Expected delta
- +$452/yr (+$38/mo · 21.1%)
ⓘ Screening estimate from a state-policy table — verify with the county assessor before closing.
Nearby sold comps map
Loading sold comps map…
Walkable amenities ~0.75 mi
Loading nearby amenities…
Taxation est. · year 1
- Rental income
- $48,888
- − Mortgage interest
- −$20,440
- − Property taxes
- −$2,139
- − Insurance
- −$1,824
- − Repairs & maintenance
- −$3,911
- − Management
- −$3,911
- − Depreciation
- −$10,615
- Taxable income
- $6,047
- Est. tax owed @ 24.0%
- −$1,451
- After-tax cash flow
- $10,244/yr
For passive investors: Depreciation is non-cash, so a rental often shows a tax loss while cash-flowing — sheltering income. Rental losses are passive: they offset passive income freely, and up to $25,000/yr can offset ordinary (W-2) income if you actively participate and your MAGI is under $100k (phasing out to $0 by $150k); unused losses carry forward. On sale, claimed depreciation is recaptured at up to 25%, and gains may owe capital-gains tax (a 1031 exchange can defer both). Figures are a year-1 estimate at your 24.0% rate — not tax advice; consult a CPA.
Condition & rehab AI · 3 photos
This multi-family home is in good condition with minimal repairs needed. It offers a good investment opportunity with potential for both resale and rental value through updates such as new flooring, smart home devices, and landscaping improvements.
Value-add opportunities
- Both Paint interior walls — Fresh paint enhances curb appeal and interior aesthetics.
- Both Replace ceiling fans — Modern ceiling fans improve airflow and aesthetics.
- Both Replace carpet with hardwood or tile — Hardwood or tile flooring increases resale value and is easier to maintain.
- Both Install smart home devices — Smart home devices improve convenience and can increase property value.
- Rental Add outdoor lighting — Outdoor lighting enhances safety and curb appeal for tenants.
- Resale Upgrade kitchen appliances — Upgraded appliances can attract more buyers and increase the home's value.
- Both Add a deck or patio — An outdoor living space increases the home's livability and can boost both resale and rental value.
- Both Landscaping improvements — Enhanced landscaping can improve curb appeal and attract more buyers/tenants.
- Both Add a smart thermostat — A smart thermostat can improve energy efficiency and comfort, attracting more buyers/tenants.
Renovation cost estimate screening
Value-add ROI direction
- Both Paint interior walls — Fresh paint enhances curb appeal and interior aesthetics. ↑
- Both Replace ceiling fans — Modern ceiling fans improve airflow and aesthetics. ↑
- Both Replace carpet with hardwood or tile — Hardwood or tile flooring increases resale value and is easier to maintain. ↑
- Both Install smart home devices — Smart home devices improve convenience and can increase property value. ↑
- Rental Add outdoor lighting — Outdoor lighting enhances safety and curb appeal for tenants. ↑
- Resale Upgrade kitchen appliances — Upgraded appliances can attract more buyers and increase the home's value. ↑
- Both Add a deck or patio — An outdoor living space increases the home's livability and can boost both resale and rental value. ↑
- Both Landscaping improvements — Enhanced landscaping can improve curb appeal and attract more buyers/tenants. ↑
- Both Add a smart thermostat — A smart thermostat can improve energy efficiency and comfort, attracting more buyers/tenants. ↑
ⓘ Cost ranges are severity-bucket heuristics (US national rule-of-thumb). Get contractor quotes + a written scope before underwriting a rehab budget.
Schools (NCES district)
- District
- Franklin County
- NCES district ID
- 4701290
- Math proficiency
- 18% ▼ -9.00%
- Reading proficiency
- 22% ▼ -8.00%
- Median HH income
- $43,108
- Composite
- 17.24/100
- National rank
- #9094
- State rank
- #111 of 139 in TN
Livability — Winchester
- Score
- 65/100
- State rank
- #149
- US rank
- #13341
Category grades
Schools grade is shown separately in the Schools card above.
Census & demographics
- Census place
- Winchester, TN
- Population (ZIP)
- 15,712
Population outlook (Franklin County) Hauer SSP2
- Today (2025)
- 42,858 people
- By 2030
- 43,540 · +1.6%
- By 2040
- 44,623 · +4.1%
- By 2050
- 45,523 · +6.2%
- By 2075
- 48,954 · +14.2%
- By 2100
- 50,170 · +17.1%
Race, ethnicity, and origin ACS 2023
- Neighborhood character
- Predominantly White (81%)
- Race & ethnicity
- White 81% Hispanic / Latino 7% Black 7% Two or more races 6% Asian 1%
- Hispanic origin (detail)
- Mexican 4%
- Common ancestry
- Serbian 2% Lithuanian 2% Slovak 1%
- Foreign-born
- 4% · Canada
- Languages at home
- 93% English-only · Spanish 5% Other Indo-European 1% German/W. Germanic 1%
Political lean MEDSL · Franklin
- 2024 margin
- Solid R (+53.2) · D 23.0% · R 76.1%
- 2008→2024 swing
- -30.6pp toward R · 2008: -22.5pp · 2024: -53.2pp
- All cycles
- 2024: R+53.2 2020: R+47.7 2016: R+43.7 2012: R+28.9 2008: R+22.5
Not yet ingested
- Civics
- —
Market trends
- HPI YoY
- ▼ -89.03%
- Current HPI
- 333.839
- Rent YoY
- —
- Metro
- —
- State GDP YoY
- ▲ 2.78%
- F500 in state
- 22
Industry mix (Fortune 500 HQ in TN)
| Industry | F500 HQs | Revenue |
|---|---|---|
| Healthcare | 3 | $91B |
|
||
| Retail | 3 | $72B |
|
||
| Transportation / Logistics | 1 | $88B |
|
||
| Paper / Packaging | 1 | $19B |
|
||
| Insurance | 1 | $13B |
|
||
| Energy | 1 | $12B |
|
||
Price history
+7.2% since first listed2 events — show timeline
- 2026-05-21 Listed $369,900 REALTRACS as Distributed by MLS Grid
- 2023-05-02 Sold (Public Records) $345,000 Public Records
Property tax history
+0.0%/yrLatest (2025): $2,139 · +0.0% YoY. Source: county tax records.
Cash-flow waterfall
monthlySold comps — $/sqft
last 12 mo · ≤1 miLoading sold comps…