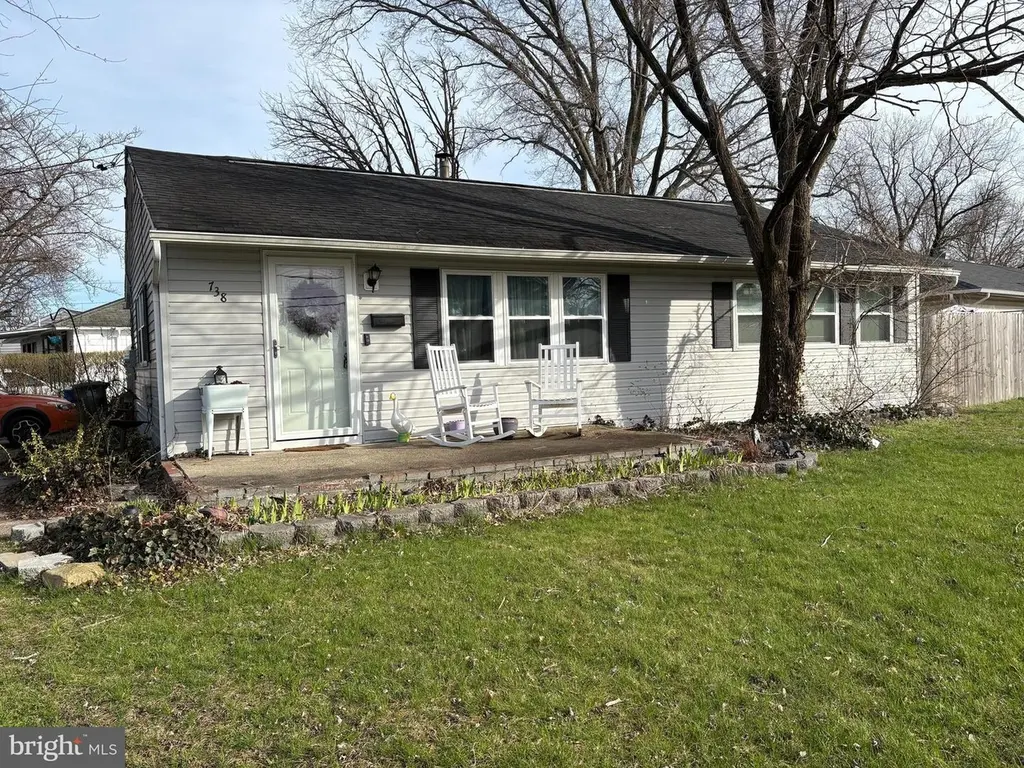
738 Main St
Vincentown, NJ 08048
$280,000D+
3 bd · 1.0 ba ·
960 sqft ·
Built 1954
· SingleFamily
· Pending
· 47 DOM
Cashflow @ list (25.0% down · 7.5%)
Estimated rent
$2,558/mo
Mortgage (P&I)
−$1,468
Tax + insurance
−$498
HOA
−$0
Vac / Maint / Mgmt
−$537
Net cashflow
$55/mo
Annual
$656/yr
Cap rate
6.53%
Cash-on-cash
0.84%
DSCR
1.04
1% rule
0.91%
Cash to close
$78,400
Investor read
- This is a 3-bed/1.0-bath single-family listed at $280k.
- At list price, monthly cash flow is $55 ($656/yr) — positive.
- The deal already cash-flows at list — no discount required.
- To meet the 1% rule (rent ≥ 1% of price), the offer needs to be $256k (8.6% below list).
- It's been on market 47 days — a 3% lower offer ($272k) is reasonable based on typical stale-listing flexibility.
- Recommended offer: $256k (8.6% below list) — sets the bar for 1% rule.
- Local home prices are declining (-3.0%/yr); year-one equity from $2k of loan paydown is wiped out by about $8k of value loss. Plan a longer hold.
- Location reads: area grade D — affects rentability + tenant quality, not the cash-flow math above.
- Lumberton Township Board Of Education (suburban): math 20% / reading 44% proficiency, ranked #292 of 472 in NJ (top 62%) — families likely to look elsewhere, expect single-tenant / working-renter base with shorter leases; only 15% free/reduced lunch — higher-income household profile.
- Watch-outs: built in 1954 — expect roof / HVAC / electrical / plumbing capex.
- Market conditions: 42 active listings in the ZIP; 6 comparable units currently listed for rent nearby; rentals leasing fast (median 2d on market — plan ~1-2 weeks tenant-placement turnaround); high-income renter base; 2,161 units permitted in Burlington County in 2024 (988 in 5+ unit buildings).
- Burlington County population projected to shrink 5% by 2050 — rents likely to lag national; underwrite the cash flow, not the appreciation.
- 6 sale attempts since 16y ago with the ask held roughly flat each time — persistent listings suggest the price (not the market) is what's stuck; bring a comps-based counter.
- Current owner paid $147k; list at $280k implies a 91% gain — meaningful room to come down on a strong offer.
- Climate carrying-cost: major wind risk, 54% chance of damaging wind over 30y; extreme-heat days projected 7→15/yr by 2055 (HVAC capex compounding) — expect insurance premiums to compound above CPI over the hold.
- Cap rate 6.5% vs local median 4.5% in Vincentown — top-decile yield for the area; either an underpriced asset or a hidden risk that comps aren't pricing in. Stress-test before assuming the spread holds.
Questions for listing agent
- It's been on market 47 days. Have you received any prior offers? Is the seller open to a 9% concession, seller financing, or rate buy-down credit?
- Built in 1954 — when were the roof, HVAC, electrical panel, plumbing, and water heater last replaced?
- Is there a deadline driving the sale (1031 exchange, divorce, estate, relocation)? That informs how much negotiation room exists.
- The area grade is low — what's the realistic commute time and amenity access for the typical tenant pool here? Any planned neighborhood developments (good or bad) we should know about?
- What's the average days-on-market for RENTAL listings here right now (not sales)? A rising rental-DOM trend means longer vacancies and softer asking-rent achievability than the comps imply.
- What's the recent tenant-quality profile in this submarket — average credit score on applications, eviction rate, late-payment / NSF rate, and stable-employment percentage? A property-management company in the area should have these aggregated.
- How much new for-sale + rental construction is in the pipeline within 1–3 miles? Heavy new supply typically softens prices + rents 12–24 months out; constrained supply supports both.
CashFlowRE · CFR-4XRW8D2CKDVEAN
· Data 3 weeks ago
cashflowre.app · 2026-05-29