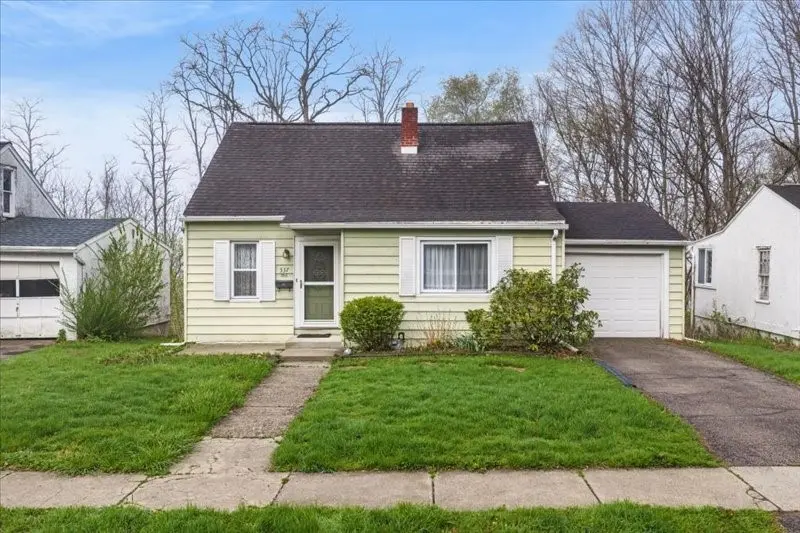
537 Woodford Ave
Endicott, NY 13760
$149,900C-
3 bd · 1.0 ba ·
1,165 sqft ·
Built 1950
· SingleFamily
· Pending
· 10 DOM
Cashflow @ list (25.0% down · 7.5%)
Estimated rent
$1,396/mo
Mortgage (P&I)
−$786
Tax + insurance
−$325
HOA
−$0
Vac / Maint / Mgmt
−$293
Net cashflow
$-8/mo
Annual
$-99/yr
Cap rate
6.23%
Cash-on-cash
-0.24%
DSCR
0.99
1% rule
0.93%
Cash to close
$41,972
Investor read
- This is a 3-bed/1.0-bath single-family listed at $150k.
- At list price, monthly cash flow is $-8 ($-99/yr) — negative.
- To cash-flow at today's rent, offer at most $148k (1.0% below list).
- To meet the 1% rule (rent ≥ 1% of price), the offer needs to be $140k (6.9% below list).
- Only 10 days on market — expect competitive offers; lowballing is unlikely to land.
- Recommended offer: $140k (6.9% below list) — sets the bar for 1% rule.
- Local home prices are declining (-3.0%/yr); year-one equity from $1k of loan paydown is wiped out by about $4k of value loss. Plan a longer hold.
- Location reads 70/100 on livability (#438 in NY) — a middle-class / working-renter tenant base. Strengths: cost of living A+, health & safety A+, housing A; Watch: amenities D, crime F, commute F.
- Union-Endicott Central School District (suburban): math 43% / reading 57% proficiency, ranked #387 of 590 in NY (top 66%) — acceptable for families but not a draw, mixed tenant base, ~2y average lease.
- Zoned schools: Charles F Johnson Jr Elementary School (math 17% / reading 27%, grade F, #1,923 of 2,108 statewide, top 92%, 387 students, 66% FRL) — zoned schools average 66% FRL vs 42% district-wide (25 pts higher); higher-poverty schools than district average — tighter screening recommended.
- Zoned-school proficiency averages 22% at this address vs 50% district-wide (-28 pts) — the specific schools serving this property underperform the Union-Endicott Central School District average; the district grade overstates school quality for this exact location.
- Watch-outs: built in 1950 — expect roof / HVAC / electrical / plumbing capex.
- Market conditions: Rents rising fast (+7.1%/yr); 213 active listings in the ZIP; 20 comparable units currently listed for rent nearby; rentals lingering (median 44d on market — plan ~5-8 weeks vacancy on turnover, expect pricing pressure); 50% of comp listings sitting > 30 days — soft ceiling on asking rent; 340 units permitted in Broome County in 2024 (269 in 5+ unit buildings).
- Broome County population projected at -13% by 2050 — secular population decline; favor cash flow + early exit over multi-decade hold.
- Current owner paid $53k; list at $150k implies a 183% gain — meaningful room to come down on a strong offer.
Questions for listing agent
- What do current leases actually rent for vs. the listed asking? Can we see a recent rent roll and the last 12 months of T-12 income?
- Built in 1950 — when were the roof, HVAC, electrical panel, plumbing, and water heater last replaced?
- Is there a deadline driving the sale (1031 exchange, divorce, estate, relocation)? That informs how much negotiation room exists.
- Schools are D-rated, which usually means shorter tenancies and higher turnover. Who's the typical renter profile here, and what's been the actual vacancy rate?
- Crime grade is F in this area — have there been break-ins, vandalism, or insurance claims at this property in the last 3 years? What carrier currently insures it and at what premium?
- What's the average days-on-market for RENTAL listings here right now (not sales)? A rising rental-DOM trend means longer vacancies and softer asking-rent achievability than the comps imply.
- What's the recent tenant-quality profile in this submarket — average credit score on applications, eviction rate, late-payment / NSF rate, and stable-employment percentage? A property-management company in the area should have these aggregated.
- How much new for-sale + rental construction is in the pipeline within 1–3 miles? Heavy new supply typically softens prices + rents 12–24 months out; constrained supply supports both.
CashFlowRE · CFR-4XTM5P5009PCXS
· Data 3 weeks ago
cashflowre.app · 2026-05-29