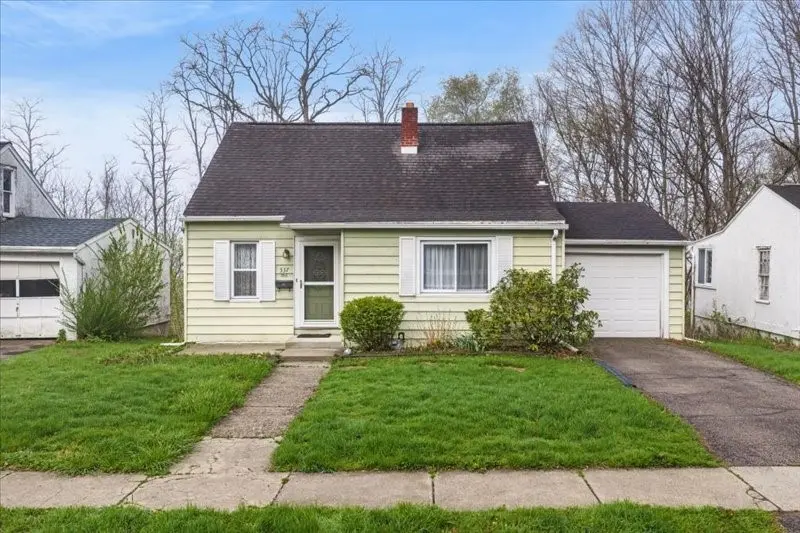
537 Woodford Ave · Endicott, NY
Flood risk 1/10 · Minimal
- FEMA flood zone
- X
- Chance of flooding over 30 yrs
- 0.0%
- Est. flood insurance / yr
- $473 – $860
Fire risk 3/10 · Minor
- Est. fire insurance / yr
- $691 – $1,283
Heat risk 3/10 · Minor
- Hot days now (above 93°F)
- 7 days/yr
- Hot days in 30 yrs
- 15 days/yr
Wind risk 2/10 · Minimal
- Chance of severe wind over 30 yrs
- 1.0%
Air-quality risk 2/10 · Minimal
- Unhealthy air days now
- 0 days/yr
- Unhealthy air days in 30 yrs
- 1 days/yr
Risk factors via First Street. Map © Google.
Why this score? — see what drove the C- grade
The composite is a weighted blend of 9 inputs, each scored 0–100. Each bar is that input's sub-score; the figure is the points it added to the 100-point composite (weight × sub-score).
- ARV discount +15.0/15.0
- Cash flow +13.0/30.0
- 1% rule +4.3/10.0
- Rent growth +4.3/5.0
- Schools +4.3/10.0
- DSCR +3.9/10.0
- Livability +3.5/5.0
- Condition / age +2.5/5.0
- Appreciation +0.0/10.0
$149,900
🖨 Deal sheet 📄 Offer letter ✓ Due diligence
Listing remarks
Charming home with a functional layout and great natural light. The kitchen offers ample cabinet and counter space, ready for everyday use. Enjoy a standout sunroom with a warm wood ceiling, walls of windows, and sliding doors overlooking the backyard perfect for relaxing or extra living space. Includes a manageable yard, attached garage, and off-street parking. Wonderful home offering a great opportunity to add your personal touch. Convenient location near shopping and major routes.
Key facts
- Warm wood ceiling
- Walls of windows
- Standout sunroom
Tags
Property features AI
Exterior
- Parking: Attached garage (1 car)
- Utilities: Public water; Public sewer; Cable available
- Home design: Single-family residence; Residential property; Above-grade finished area, with additional finished space below grade
- Construction: Aluminum siding
- Exterior features: Deck; Sloped down lot; Lot dimensions approximately 50 x 107
Interior
- Kitchen: Range; Free-standing range; Refrigerator
- Flooring: Carpet; Vinyl
- Bathrooms: 1 full bathroom
- Heating & cooling: Forced air heating; Has heating
- Interior features: Exhaust fan; Gas water heater
- Laundry & utility: Washer; Dryer
Neighborhood map
What this means for you Summary
Snapshot
- This is a 3-bed/1.0-bath single-family listed at $150k.
Deal economics
- At list price, monthly cash flow is $-8 ($-99/yr) — negative.
- To cash-flow at today's rent, offer at most $148k (1.0% below list).
- To meet the 1% rule (rent ≥ 1% of price), the offer needs to be $140k (6.9% below list).
- Recommended offer: $140k (6.9% below list) — sets the bar for 1% rule.
Location & tenants
- Location reads 70/100 on livability (#438 in NY) — a middle-class / working-renter tenant base. Strengths: cost of living A+, health & safety A+, housing A; Watch: amenities D, crime F, commute F.
- Union-Endicott Central School District (suburban): math 43% / reading 57% proficiency, ranked #387 of 590 in NY (top 66%) — acceptable for families but not a draw, mixed tenant base, ~2y average lease.
- Zoned schools: Charles F Johnson Jr Elementary School (math 17% / reading 27%, grade F, #1,923 of 2,108 statewide, top 92%, 387 students, 66% FRL) — zoned schools average 66% FRL vs 42% district-wide (25 pts higher); higher-poverty schools than district average — tighter screening recommended.
- Zoned-school proficiency averages 22% at this address vs 50% district-wide (-28 pts) — the specific schools serving this property underperform the Union-Endicott Central School District average; the district grade overstates school quality for this exact location.
- Market conditions: Rents rising fast (+7.1%/yr); 213 active listings in the ZIP; 20 comparable units currently listed for rent nearby; rentals lingering (median 44d on market — plan ~5-8 weeks vacancy on turnover, expect pricing pressure); 50% of comp listings sitting > 30 days — soft ceiling on asking rent; 340 units permitted in Broome County in 2024 (269 in 5+ unit buildings).
Forward outlook
- Local home prices are declining (-3.0%/yr); year-one equity from $1k of loan paydown is wiped out by about $4k of value loss. Plan a longer hold.
- Broome County population projected at -13% by 2050 — secular population decline; favor cash flow + early exit over multi-decade hold.
Negotiation context
- Only 10 days on market — expect competitive offers; lowballing is unlikely to land.
- Current owner paid $53k; list at $150k implies a 183% gain — meaningful room to come down on a strong offer.
Risks & watch-outs
- Watch-outs: built in 1950 — expect roof / HVAC / electrical / plumbing capex.
Questions for the listing agent
- What do current leases actually rent for vs. the listed asking? Can we see a recent rent roll and the last 12 months of T-12 income?
- Built in 1950 — when were the roof, HVAC, electrical panel, plumbing, and water heater last replaced?
- Is there a deadline driving the sale (1031 exchange, divorce, estate, relocation)? That informs how much negotiation room exists.
- Schools are D-rated, which usually means shorter tenancies and higher turnover. Who's the typical renter profile here, and what's been the actual vacancy rate?
- Crime grade is F in this area — have there been break-ins, vandalism, or insurance claims at this property in the last 3 years? What carrier currently insures it and at what premium?
- What's the average days-on-market for RENTAL listings here right now (not sales)? A rising rental-DOM trend means longer vacancies and softer asking-rent achievability than the comps imply.
- What's the recent tenant-quality profile in this submarket — average credit score on applications, eviction rate, late-payment / NSF rate, and stable-employment percentage? A property-management company in the area should have these aggregated.
- How much new for-sale + rental construction is in the pipeline within 1–3 miles? Heavy new supply typically softens prices + rents 12–24 months out; constrained supply supports both.
Investment metrics
- 1% rule
- 0.93% ✗
- Cap rate
- 6.23%
- Cash-on-cash
- -0.24%
- DSCR
- 0.99
- GRM
- 8.9
CMA / ARV
- ARV (median comp)
- $188,932
- List price
- $149,900
- Delta
- -20.66%
- Verdict
- UNDERPRICED
- Comps
- 20 within 1.0 mi
Show comp detail 12 sales within ~0.75 mi
| Address | Dist | Beds/Ba | Sqft | Sold | Price | $/sf | Match |
|---|---|---|---|---|---|---|---|
| 124 W Wendell St. St | 0.30mi | 3/1.0 | 1,143 (-2%) | 4mo | $155,000 | $136 | 80 |
| 111 W Wendell St | 0.25mi | 3/1.0 | 1,251 (+7%) | 12mo | $172,000 | $137 | 66 |
| 223 Jamaica Blvd | 0.67mi | 3/1.0 | 1,176 (+1%) | 3mo | $215,000 | $183 | 65 |
| 207 N Page Ave | 0.57mi | 3/1.5 | 1,196 (+3%) | 3mo | $170,000 | $142 | 65 |
| 201 Sliter Pl | 0.54mi | 3/2.0 | 1,177 (+1%) | 6mo | $196,201 | $167 | 64 |
| 110 Cleveland Ave | 0.71mi | 3/1.0 | 1,176 (+1%) | 6mo | $86,000 | $73 | 60 |
| 607 Wallace St | 0.64mi | 3/1.0 | 1,122 (-4%) | 6mo | $165,000 | $147 | 59 |
| 915 Harvard St | 0.41mi | 2/1.0 (-1) | 1,078 (-8%) | 7mo | $175,000 | $162 | 58 |
| 411 E Franklin St E | 0.39mi | 4/1.0 (+1) | 1,296 (+11%) | 7mo | $115,000 | $89 | 52 |
| 15 Robble Ave | 0.61mi | 2/1.0 (-1) | 1,242 (+7%) | 10mo | $117,000 | $94 | 47 |
| 804 Glendale Dr | 0.59mi | 2/1.0 (-1) | 1,282 (+10%) | 7mo | $65,000 | $51 | 45 |
| 11 Lincoln Ave | 0.74mi | 3/1.5 | 1,318 (+13%) | 10mo | $155,000 | $118 | 33 |
Match score weights: distance 35% · size 25% · config 20% · recency 20%. Top-matched comps best support the ARV.
Projected returns pro-forma
-3.0% appreciation · 7.09% rent growth · sell at horizon
- IRR
- -11.9%
- Equity multiple
- 0.55×
- Total profit
- $-18,769
- Equity at exit
- $22,351
- IRR
- 2.8%
- Equity multiple
- 1.24×
- Total profit
- $9,953
- Equity at exit
- $12,961
Cash invested: $41,972 (down + closing). Projections, not guarantees.
Landlord ↔ Tenant lean methodology
- Overall (STATE)
- 15 Strongly Tenant-Friendly
- State New York
- 15 Strongly Tenant-Friendly · D+10
- County
- — inherits STATE
- City
- — inherits STATE
ZIP-level market 13760
- Home prices YoY
- -32.7%
- Rents YoY
- 7.1%
- Active inventory
- 213
- Price-to-rent
- 8.9×
Monthly cashflow live
- Estimated rent
- $1,396 high interval (Pro) →
- Mortgage (P&I)
- −$786
- Tax from tax record
- −$262 /mo · $3,149/yr
- Insurance
- −$62
- HOA
- −$0
- Vacancy / Maint / Mgmt
- −$293
- Net cashflow
- $-8
Break-even live
UW: 25.0% down · 7.5% · 30yr · 1.5% tax · 5.0% vac · 8.0% maint · 8.0% mgmt
Financing live
Cash to close
- Down payment
- $37,475
- Closing costs
- $4,497
- Reserves months
- —
- Total cash needed
- —
Loan-product check · same deal, 3 products live
Conventional
25% down · 7.5% · 30yr
- Down + closing
- —
- Monthly P&I
- —
- Monthly cashflow
- —
- DSCR
- —
- Eligible?
- —
Personal DTI + credit; lowest rate.
DSCR
20% down · 8.5% · 30yr
- Down + closing
- —
- Monthly P&I
- —
- Monthly cashflow
- —
- DSCR
- —
- Eligible?
- —
No personal income docs; deal must DSCR.
Hard money
10% down · 12.0% · 12mo
- Down + closing
- —
- Monthly P&I
- —
- Monthly cashflow
- —
- DSCR
- —
- Eligible?
- —
Short-term bridge; refi at stabilization.
Rent comps 20 comps
| Address | Beds | Baths | Sqft | Rent | $/sqft | DOM | Units | Dist |
|---|---|---|---|---|---|---|---|---|
| 207 S Loder Ave Unit D-15 Endicott, NY | 2.0 | 1.0 | 700 | $925 | $1.32 | 21d | 1 | 0.62mi |
| 800 North St Unit 1 Endicott, NY | 3.0 | 1.0 | 800 | $1,300 | $1.62 | 43d | 1 | 0.64mi |
| 804 Broad St Unit 2 Endicott, NY | 3.0 | 1.0 | 975 | $1,500 | $1.54 | 43d | 1 | 0.73mi |
| 404 Exchange Ave Endicott, NY | 2.0 | 1.0 | 850 | $1,100 | $1.29 | 43d | 1 | 0.79mi |
| 469 Glendale Dr Unit 35 Endicott, NY | 2.0 | 2.0 | 850 | $1,200 | $1.41 | 21d | 1 | 0.81mi |
| 106 Madison Ave Unit 1 Endicott, NY | 3.0 | 1.0 | 1050 | $1,500 | $1.43 | 43d | 1 | 0.87mi |
| 53 Washington Ave Unit 2 Endicott, NY | 2.0 | 1.0 | 1180 | $1,300 | $1.10 | 21d | 1 | 0.94mi |
| 1 Jane Lacey Dr Endicott, NY | 1.0–3.0 | 1.0–1.5 | 900 | $1,305 | $1.45 | 21d | 1 | 0.97mi |
| 124 Squires Ave Unit 2 Endicott, NY | 2.0 | 1.0 | 750 | $1,100 | $1.47 | 43d | 1 | 1.06mi |
| 204 Rogers Ave Endicott, NY | 2.0 | 1.5 | 1456 | $2,000 | $1.37 | 21d | 1 | 1.13mi |
| 1211 Pine St #1 Endicott, NY | 3.0 | 1.0 | 952 | $1,400 | $1.47 | 43d | 1 | 1.14mi |
| 317 Rogers Ave Endicott, NY | 2.0 | 1.0 | 900 | $1,300 | $1.44 | 21d | 1 | 1.18mi |
| 317 Rogers Ave Unit 2 Endicott, NY | 3.0 | 1.0 | 1000 | $1,300 | $1.30 | 21d | 1 | 1.18mi |
| 507 Hill Ave Unit 1 Endicott, NY | 2.0 | 1.0 | 1072 | $1,450 | $1.35 | 43d | 1 | 1.19mi |
| 112 N Roosevelt Ave Endicott, NY | 3.0 | 2.0 | 1299 | $1,850 | $1.42 | 43d | 1 | 1.21mi |
| 305 Adams Ave Endicott, NY | 3.0 | 1.0 | 800 | $1,450 | $1.81 | 21d | 1 | 1.29mi |
| 107 N Jackson Ave Apt 2 Endicott, NY | 2.0 | 1.0 | 950 | $1,350 | $1.42 | 43d | 1 | 1.34mi |
| 1901 Tracy St Fl Ea Endicott, NY | 2.0 | 1.0 | 986 | $1,200 | $1.22 | 21d | 1 | 1.37mi |
| 1807 Riverview Dr #1 Endicott, NY | 3.0 | 1.5 | 1266 | $1,800 | $1.42 | 21d | 1 | 1.44mi |
| 2007 Tracy St Unit 1st Floor Endicott, NY | 2.0 | 1.0 | 819 | $1,250 | $1.53 | 43d | 1 | 1.44mi |
Listing history 3 events
-
2026-05-04status Pending 488-char remark
-
2026-04-24$149,900 Active 488-char remark
-
2020-03-19soldstatus $53,000
ⓘ Source: listings_history table (triggers on properties + properties_extension) + one-shot
backfill from property_details.listing_events for pre-trigger history.
Tax reassessment forecast NY · Partial reset (capped growth)
- Current annual tax
- $3,149 · $262/mo
- Projected year-2 tax
- $3,149 · $262/mo
- Expected delta
- $0/yr ($0/mo · 0.0%)
ⓘ Screening estimate from a state-policy table — verify with the county assessor before closing.
Climate risk First Street
- Flood 1/10 Low FEMA zone X · 0% chance over 30 yrs
- Wildfire 3/10 Moderate
- Heat 3/10 Moderate 7 d/yr ≥93°F today · 15 d/yr by 30 yrs out
- Wind 2/10 Low 100% chance of damaging wind over 30 yrs
- Air quality 2/10 Low 0 unhealthy d/yr today · 1 by 30 yrs out
Nearby sold comps map
Loading sold comps map…
Walkable amenities ~0.75 mi
Loading nearby amenities…
Taxation est. · year 1
- Rental income
- $16,750
- − Mortgage interest
- −$8,397
- − Property taxes
- −$3,149
- − Insurance
- −$750
- − Repairs & maintenance
- −$1,340
- − Management
- −$1,340
- − Depreciation
- −$4,361
- Taxable loss
- −$2,586
- Est. tax savings @ 24.0%
- +$621
- After-tax cash flow
- $521/yr
For passive investors: Depreciation is non-cash, so a rental often shows a tax loss while cash-flowing — sheltering income. Rental losses are passive: they offset passive income freely, and up to $25,000/yr can offset ordinary (W-2) income if you actively participate and your MAGI is under $100k (phasing out to $0 by $150k); unused losses carry forward. On sale, claimed depreciation is recaptured at up to 25%, and gains may owe capital-gains tax (a 1031 exchange can defer both). Figures are a year-1 estimate at your 24.0% rate — not tax advice; consult a CPA.
Schools (NCES district)
- District
- Union-Endicott Central School District
- NCES district ID
- 3610710
- Math proficiency
- 43% ▼ -9.00%
- Reading proficiency
- 57% ▲ 11.00%
- Median HH income
- $49,265
- Composite
- 42.66/100
- National rank
- #3176
- State rank
- #387 of 590 in NY
Livability — Endicott
- Score
- 70/100
- State rank
- #438
- US rank
- #7657
Category grades
Schools grade is shown separately in the Schools card above.
Census & demographics
- Census place
- Endicott, NY
- County
- Broome County · 126,805 people
- City population
- 42,896
- Metro
- Binghamton, NY
- Population (ZIP)
- 42,896
- Household income
- $66,095
- Rent vs Own
- Severe rent burden
- 1480.0
Population outlook (Broome County) Hauer SSP2
- Today (2025)
- 187,989 people
- By 2030
- 183,066 · -2.6%
- By 2040
- 172,228 · -8.4%
- By 2050
- 163,161 · -13.2%
- By 2075
- 153,641 · -18.3%
- By 2100
- 140,851 · -25.1%
Race, ethnicity, and origin ACS 2023
- Neighborhood character
- Predominantly White (84%)
- Race & ethnicity
- White 84% Two or more races 7% Hispanic / Latino 6% Black 4% Asian 2%
- Hispanic origin (detail)
- Puerto Rican 2%
- Common ancestry
- Romanian 6% Lithuanian 2% Slovak 2%
- Foreign-born
- 5% · Canada, China
- Languages at home
- 94% English-only · Spanish 2% Other Indo-European 1% Russian/Polish/Slavic 1%
Political lean MEDSL · Broome
- 2024 margin
- Toss-up / Even · D 50.2% · R 49.8%
- 2008→2024 swing
- -7.6pp toward R · 2008: 8.0pp · 2024: 0.4pp
- All cycles
- 2024: D+0.4 2020: D+3.5 2016: R+3.7 2012: D+4.6 2008: D+8.0
Not yet ingested
- Civics
- —
Market trends
- HPI YoY
- ▼ -131.29%
- Current HPI
- 270.2661
- Rent YoY
- ▲ 7.09%
- Metro
- Binghamton, NY
- State GDP YoY
- ▲ 2.60%
- F500 in state
- 92
Industry mix (Fortune 500 HQ in NY)
| Industry | F500 HQs | Revenue |
|---|---|---|
| Financial Services | 10 | $950B |
|
||
| Consumer Goods | 9 | $162B |
|
||
| Insurance | 4 | $225B |
|
||
| Telecommunications | 2 | $144B |
|
||
| Pharmaceuticals | 2 | $112B |
|
||
| Media / Entertainment | 2 | $69B |
|
||
Price history
+182.8% since first listed3 events — show timeline
- 2026-05-04 Pending — GBAOR
- 2026-04-24 Listed $149,900 GBAOR
- 2020-03-19 Sold (Public Records) $53,000 Public Records
Property tax history
+4.8%/yrLatest (2025): $3,149 · +3.4% YoY. Source: county tax records.
Cash-flow waterfall
monthlySold comps — $/sqft
last 12 mo · ≤1 miLoading sold comps…