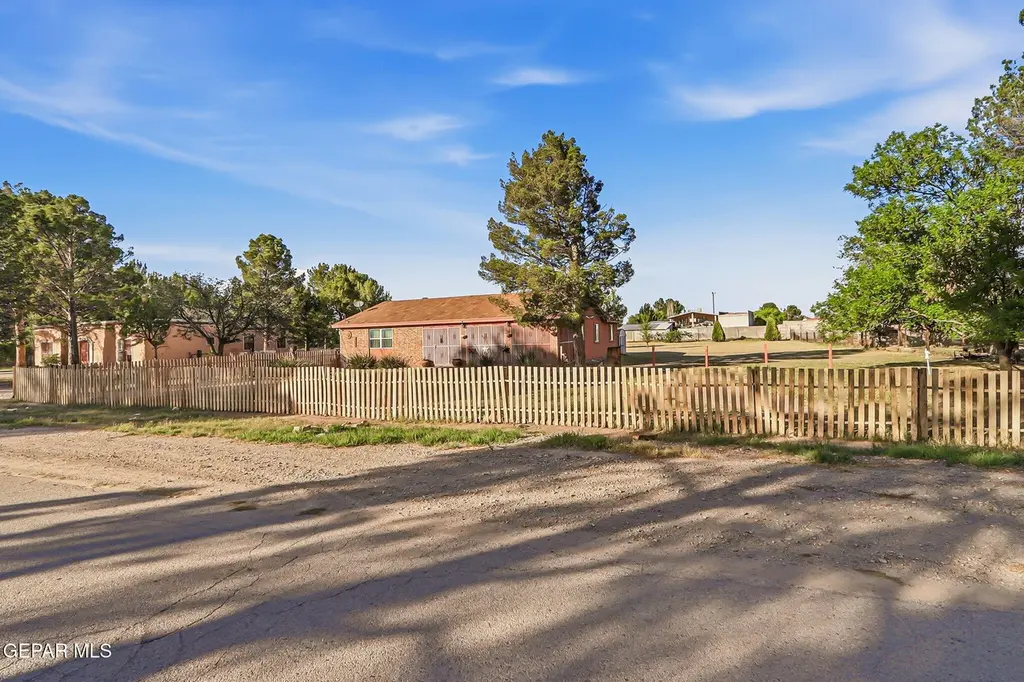
12243 Heritage Way
Clint, TX 79836
$194,700D
3 bd · 1.0 ba ·
2,076 sqft ·
Built 1987
· SingleFamily
· Pending
· 5 DOM
Cashflow @ list (25.0% down · 7.5%)
Estimated rent
$1,714/mo
Mortgage (P&I)
−$1,021
Tax + insurance
−$387
HOA
−$0
Vac / Maint / Mgmt
−$360
Net cashflow
$-54/mo
Annual
$-653/yr
Cap rate
5.96%
Cash-on-cash
-1.20%
DSCR
0.95
1% rule
0.88%
Cash to close
$54,516
Investor read
- This is a 3-bed/1.0-bath single-family listed at $195k.
- At list price, monthly cash flow is $-54 ($-653/yr) — negative.
- To cash-flow at today's rent, offer at most $185k (4.9% below list).
- To meet the 1% rule (rent ≥ 1% of price), the offer needs to be $171k (12.0% below list).
- Only 5 days on market — expect competitive offers; lowballing is unlikely to land.
- Recommended offer: $171k (12.0% below list) — sets the bar for 1% rule.
- In year one you build about $10k of equity ($1k loan paydown + $8k appreciation (4.3% local appreciation)).
- Location reads 55/100 on livability (#1,340 in TX) — a working-class tenant base; expect higher turnover. Strengths: cost of living A+, housing B+; Watch: crime F, amenities F, commute F.
- Clint ISD (suburban): math 14% / reading 22% proficiency, ranked #792 of 826 in TX (top 96%) — low school quality limits family demand, transient renter base, plan for 1-2y turnover.
- Zoned schools: Wm David Surratt El (math 16% / reading 19%, grade F, #3,805 of 4,322 statewide, top 89%, 957 students, 82% FRL); Clint J H School (math 9% / reading 14%, grade F, #1,629 of 1,662 statewide, top 98%, 529 students, 84% FRL); Clint H S (math 12% / reading 28%, grade F, #1,397 of 1,632 statewide, top 87%, 745 students, 82% FRL) — zoned schools average 82% FRL vs 59% district-wide (23 pts higher); higher-poverty schools than district average — tighter screening recommended.
- Market conditions: 147 active listings in the ZIP; 5 comparable units currently listed for rent nearby; rentals leasing fast (median 5d on market — plan ~1-2 weeks tenant-placement turnaround); 2,196 units permitted in El Paso County in 2024 (143 in 5+ unit buildings).
- El Paso County population projected at +10% by 2050 — modest demand growth; plan on rents tracking national, not racing it.
- At projected returns (4.3% appreciation + 3.0% rent growth), your $55k cash investment doubles in ~6 years — after that, you're playing with house money.
- By year 4, paydown + projected appreciation supports a ~$33k cash-out refi (75% LTV) — recoverable capital for the next deal without selling this one.
- Climate carrying-cost: moderate flood risk; extreme-heat days projected 7→25/yr by 2055 (HVAC capex compounding) — expect insurance premiums to compound above CPI over the hold.
Questions for listing agent
- What do current leases actually rent for vs. the listed asking? Can we see a recent rent roll and the last 12 months of T-12 income?
- Is there a deadline driving the sale (1031 exchange, divorce, estate, relocation)? That informs how much negotiation room exists.
- Crime grade is F in this area — have there been break-ins, vandalism, or insurance claims at this property in the last 3 years? What carrier currently insures it and at what premium?
- The area grade is low — what's the realistic commute time and amenity access for the typical tenant pool here? Any planned neighborhood developments (good or bad) we should know about?
- What's the average days-on-market for RENTAL listings here right now (not sales)? A rising rental-DOM trend means longer vacancies and softer asking-rent achievability than the comps imply.
- What's the recent tenant-quality profile in this submarket — average credit score on applications, eviction rate, late-payment / NSF rate, and stable-employment percentage? A property-management company in the area should have these aggregated.
- How much new for-sale + rental construction is in the pipeline within 1–3 miles? Heavy new supply typically softens prices + rents 12–24 months out; constrained supply supports both.
CashFlowRE · CFR-4Z1K2Q0CQDMKV0
· Data 4 weeks ago
cashflowre.app · 2026-05-29