12243 Heritage Way · Clint, TX
Flood risk 5/10 · Moderate
- FEMA flood zone
- X
- Chance of flooding over 30 yrs
- 0.24%
- Est. flood insurance / yr
- $507 – $1,088
Fire risk 3/10 · Minor
- Est. fire insurance / yr
- $1,222 – $2,270
Heat risk 6/10 · Moderate
- Hot days now (above 101°F)
- 7 days/yr
- Hot days in 30 yrs
- 25 days/yr
Wind risk 1/10 · Minimal
- Chance of severe wind over 30 yrs
- —
Air-quality risk 3/10 · Minor
- Unhealthy air days now
- 2 days/yr
- Unhealthy air days in 30 yrs
- 2 days/yr
Risk factors via First Street. Map © Google.
Why this score? — see what drove the D grade
The composite is a weighted blend of 9 inputs, each scored 0–100. Each bar is that input's sub-score; the figure is the points it added to the 100-point composite (weight × sub-score).
- Cash flow +11.8/30.0
- ARV discount +7.5/15.0
- Appreciation +7.2/10.0
- 1% rule +3.8/10.0
- DSCR +3.5/10.0
- Livability +2.8/5.0
- Rent growth +2.5/5.0
- Condition / age +2.5/5.0
- Schools +1.5/10.0
$194,700
🖨 Deal sheet (PDF) 📄 Offer letter ✓ Due diligence
Listing remarks
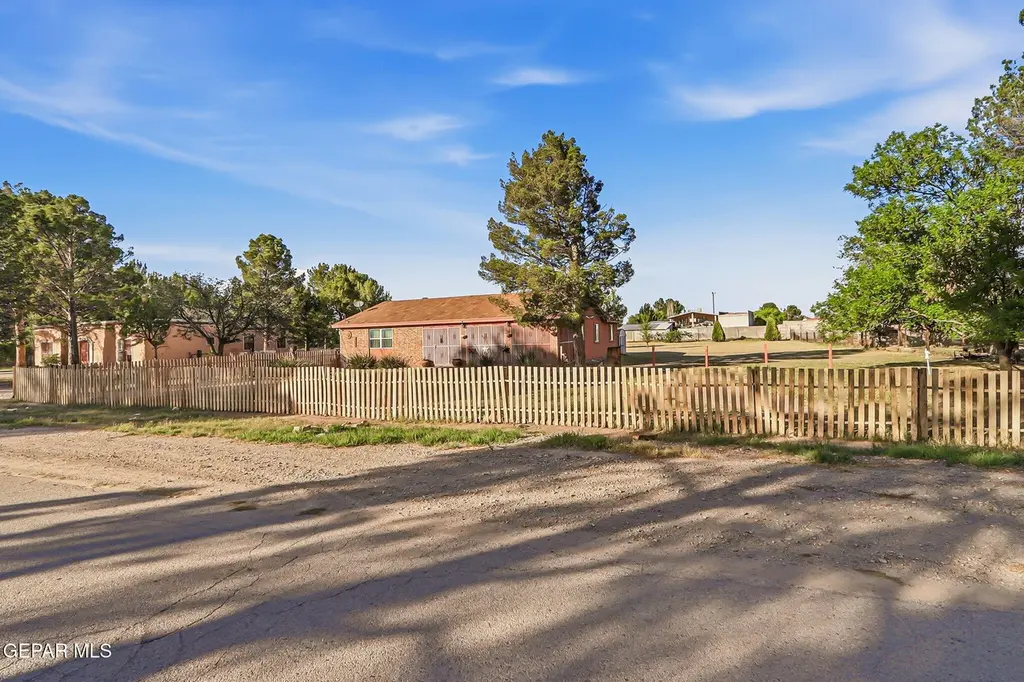
Welcome to this charming 2,076 sq. ft. house that sits on a spacious . 99-acre fenced lot in a nice entrance to a quiet cul-de-sac. Situated in the Town of Clint, it offers both privacy and plenty of room for outdoor activities. With great potential and ample space to expand, the existing structure is on nearly one-acre lot. Has Refrigerated Air, City water and sewer, a nice front security screened porch. It is just awaiting customization and upgrades for the perfect owner to turn it into their ideal Home.
Key facts
- Quiet cul-de-sac
- Fenced lot
- 0.99 acre lot
Tags
Neighborhood map
What this means for you Summary
Snapshot
- This is a 3-bed/1.0-bath single-family listed at $195k.
Deal economics
- At list price, monthly cash flow is $-54 ($-653/yr) — negative.
- To cash-flow at today's rent, offer at most $185k (4.9% below list).
- To meet the 1% rule (rent ≥ 1% of price), the offer needs to be $171k (12.0% below list).
- Recommended offer: $171k (12.0% below list) — sets the bar for 1% rule.
Location & tenants
- Location reads 55/100 on livability (#1,340 in TX) — a working-class tenant base; expect higher turnover. Strengths: cost of living A+, housing B+; Watch: crime F, amenities F, commute F.
- Clint ISD (suburban): math 14% / reading 22% proficiency, ranked #792 of 826 in TX (top 96%) — low school quality limits family demand, transient renter base, plan for 1-2y turnover.
- Zoned schools: Wm David Surratt El (math 16% / reading 19%, grade F, #3,805 of 4,322 statewide, top 89%, 957 students, 82% FRL); Clint J H School (math 9% / reading 14%, grade F, #1,629 of 1,662 statewide, top 98%, 529 students, 84% FRL); Clint H S (math 12% / reading 28%, grade F, #1,397 of 1,632 statewide, top 87%, 745 students, 82% FRL) — zoned schools average 82% FRL vs 59% district-wide (23 pts higher); higher-poverty schools than district average — tighter screening recommended.
- Market conditions: 147 active listings in the ZIP; 5 comparable units currently listed for rent nearby; rentals leasing fast (median 5d on market — plan ~1-2 weeks tenant-placement turnaround); 2,196 units permitted in El Paso County in 2024 (143 in 5+ unit buildings).
Forward outlook
- In year one you build about $10k of equity ($1k loan paydown + $8k appreciation (4.3% local appreciation)).
- El Paso County population projected at +10% by 2050 — modest demand growth; plan on rents tracking national, not racing it.
- At projected returns (4.3% appreciation + 3.0% rent growth), your $55k cash investment doubles in ~6 years — after that, you're playing with house money.
- By year 4, paydown + projected appreciation supports a ~$33k cash-out refi (75% LTV) — recoverable capital for the next deal without selling this one.
Negotiation context
- Only 5 days on market — expect competitive offers; lowballing is unlikely to land.
Risks & watch-outs
- Climate carrying-cost: moderate flood risk; extreme-heat days projected 7→25/yr by 2055 (HVAC capex compounding) — expect insurance premiums to compound above CPI over the hold.
Questions for the listing agent
- What do current leases actually rent for vs. the listed asking? Can we see a recent rent roll and the last 12 months of T-12 income?
- Is there a deadline driving the sale (1031 exchange, divorce, estate, relocation)? That informs how much negotiation room exists.
- Crime grade is F in this area — have there been break-ins, vandalism, or insurance claims at this property in the last 3 years? What carrier currently insures it and at what premium?
- The area grade is low — what's the realistic commute time and amenity access for the typical tenant pool here? Any planned neighborhood developments (good or bad) we should know about?
- What's the average days-on-market for RENTAL listings here right now (not sales)? A rising rental-DOM trend means longer vacancies and softer asking-rent achievability than the comps imply.
- What's the recent tenant-quality profile in this submarket — average credit score on applications, eviction rate, late-payment / NSF rate, and stable-employment percentage? A property-management company in the area should have these aggregated.
- How much new for-sale + rental construction is in the pipeline within 1–3 miles? Heavy new supply typically softens prices + rents 12–24 months out; constrained supply supports both.
Investment metrics
- 1% rule
- 0.88% ✗
- Cap rate
- 5.96%
- Cash-on-cash
- -1.20%
- DSCR
- 0.95
- GRM
- 9.5
CMA / ARV
No comps found within radius.
Projected returns pro-forma
4.31% appreciation · 3.0% rent growth · sell at horizon
- IRR
- 10.1%
- Equity multiple
- 1.62×
- Total profit
- $33,858
- Equity at exit
- $102,234
- IRR
- 11.8%
- Equity multiple
- 3.01×
- Total profit
- $109,412
- Equity at exit
- $170,083
Cash invested: $54,516 (down + closing). Projections, not guarantees.
Landlord ↔ Tenant lean methodology
- Overall (STATE)
- 87 Strongly Landlord-Friendly
- State Texas
- 87 Strongly Landlord-Friendly · R+5
- County
- — inherits STATE
- City
- — inherits STATE
ZIP-level market 79836
- Home prices YoY
- 2.6%
- Active inventory
- 147
- Price-to-rent
- 9.5×
Monthly cashflow live
- Estimated rent
- $1,714 high interval (Pro) →
- Mortgage (P&I)
- −$1,021
- Tax from tax record
- −$306 /mo · $3,672/yr
- Insurance
- −$81
- HOA
- −$0
- Vacancy / Maint / Mgmt
- −$360
- Net cashflow
- $-54
Break-even live
Sensitivity live
| Price | -10% $56 | -5% $1 | +0% $-54 | +5% $-110 | +10% $-165 |
|---|---|---|---|---|---|
| Rent | -10% $-190 | -5% $-122 | +0% $-54 | +5% $13 | +10% $81 |
| Rate | -1.0pp $44 | -0.5pp $-5 | base $-54 | +0.5pp $-105 | +1.0pp $-156 |
UW: 25.0% down · 7.5% · 30yr · 1.5% tax · 5.0% vac · 8.0% maint · 8.0% mgmt
Financing live
Cash to close
- Down payment
- $48,675
- Closing costs
- $5,841
- Reserves months
- —
- Total cash needed
- —
Loan-product check · same deal, 3 products live
Conventional
25% down · 7.5% · 30yr
- Down + closing
- —
- Monthly P&I
- —
- Monthly cashflow
- —
- DSCR
- —
- Eligible?
- —
Personal DTI + credit; lowest rate.
DSCR
20% down · 8.5% · 30yr
- Down + closing
- —
- Monthly P&I
- —
- Monthly cashflow
- —
- DSCR
- —
- Eligible?
- —
No personal income docs; deal must DSCR.
Hard money
10% down · 12.0% · 12mo
- Down + closing
- —
- Monthly P&I
- —
- Monthly cashflow
- —
- DSCR
- —
- Eligible?
- —
Short-term bridge; refi at stabilization.
Rent comps 5 comps
| Address | Beds | Baths | Sqft | Rent | $/sqft | DOM | Units | Dist |
|---|---|---|---|---|---|---|---|---|
| 301 Vida Bonita Way Clint, TX | 3.0 | 3.0 | 1400 | $1,350 | $0.96 | 4d | 1 | 0.65mi |
| 330 Plantation Clint, TX | 4.0 | 3.0 | 1680 | $1,750 | $1.04 | 4d | 1 | 0.77mi |
| 390 Burkett Clint, TX | 3.0 | 2.0 | 2040 | $1,850 | $0.91 | 4d | 1 | 0.98mi |
| 476 Deserts Dr Socorro, TX | 4.0 | 2.0 | 1563 | $1,999 | $1.28 | 4d | 1 | 1.24mi |
| 12049 Hidden Gardens Pl El Paso, TX | 4.0 | 2.0 | 1467 | $1,775 | $1.21 | 25d | 1 | 1.40mi |
Listing history 3 events
-
2026-04-18status Pending
-
2026-04-13$194,700 Active
-
1986-08-26soldstatus
ⓘ Source: listings_history table (triggers on properties + properties_extension) + one-shot
backfill from property_details.listing_events for pre-trigger history.
Tax reassessment forecast TX · Resets to sale price
- Current annual tax
- $3,672 · $306/mo
- Projected year-2 tax
- $3,672 · $306/mo
- Expected delta
- $0/yr ($0/mo · -0.0%)
ⓘ Screening estimate from a state-policy table — verify with the county assessor before closing.
Climate risk First Street
- Flood 5/10 Major FEMA zone X · 24% chance over 30 yrs
- Wildfire 3/10 Moderate
- Heat 6/10 Major 7 d/yr ≥101°F today · 25 d/yr by 30 yrs out
- Wind 1/10 Low
- Air quality 3/10 Moderate 2 unhealthy d/yr today · 2 by 30 yrs out
Nearby sold comps map
Loading sold comps map…
Walkable amenities ~0.75 mi
Loading nearby amenities…
Taxation est. · year 1
- Rental income
- $20,562
- − Mortgage interest
- −$10,906
- − Property taxes
- −$3,672
- − Insurance
- −$974
- − Repairs & maintenance
- −$1,645
- − Management
- −$1,645
- − Depreciation
- −$5,664
- Taxable loss
- −$3,943
- Est. tax savings @ 24.0%
- +$946
- After-tax cash flow
- $293/yr
For passive investors: Depreciation is non-cash, so a rental often shows a tax loss while cash-flowing — sheltering income. Rental losses are passive: they offset passive income freely, and up to $25,000/yr can offset ordinary (W-2) income if you actively participate and your MAGI is under $100k (phasing out to $0 by $150k); unused losses carry forward. On sale, claimed depreciation is recaptured at up to 25%, and gains may owe capital-gains tax (a 1031 exchange can defer both). Figures are a year-1 estimate at your 24.0% rate — not tax advice; consult a CPA.
Schools (NCES district)
- District
- Clint ISD
- NCES district ID
- 4814430
- Math proficiency
- 14% ▼ -32.00%
- Reading proficiency
- 22% ▼ -15.00%
- Median HH income
- $37,490
- Composite
- 15.03/100
- National rank
- #9356
- State rank
- #792 of 826 in TX
Livability — Clint
- Score
- 55/100
- State rank
- #1340
- US rank
- #23128
Category grades
Schools grade is shown separately in the Schools card above.
Census & demographics
- Population (ZIP)
- 7,481
Population outlook (El Paso County) Hauer SSP2
- Today (2025)
- 897,899 people
- By 2030
- 922,694 · +2.8%
- By 2040
- 960,492 · +7.0%
- By 2050
- 982,919 · +9.5%
- By 2075
- 997,266 · +11.1%
- By 2100
- 900,630 · +0.3%
Race, ethnicity, and origin ACS 2023
- Neighborhood character
- Predominantly Hispanic (90%)
- Race & ethnicity
- Hispanic / Latino 90% Two or more races 40% White 6% Black 3%
- Hispanic origin (detail)
- Mexican 87%
- Foreign-born
- 23% · Canada
- Languages at home
- 20% English-only · Spanish 79%
Political lean MEDSL · El Paso
- 2024 margin
- D (+15.1) · D 57.0% · R 41.8% · Other 1.2%
- 2008→2024 swing
- -17.4pp toward R · 2008: 32.5pp · 2024: 15.1pp
- All cycles
- 2024: D+15.1 2020: D+35.1 2016: D+43.2 2012: D+32.6 2008: D+32.5
Not yet ingested
- Civics
- —
Market trends
- HPI YoY
- ▲ 4.31%
- Current HPI
- 166.8578
- Rent YoY
- —
- Metro
- —
- State GDP YoY
- ▲ 3.95%
- F500 in state
- 110
Industry mix (Fortune 500 HQ in TX)
| Industry | F500 HQs | Revenue |
|---|---|---|
| Energy | 16 | $1,198B |
|
||
| Technology | 5 | $198B |
|
||
| Engineering / Construction | 4 | $72B |
|
||
| Energy Services | 3 | $60B |
|
||
| Utilities | 3 | $41B |
|
||
| Healthcare | 2 | $330B |
|
||
Price history
3 events — show timeline
- 2026-04-18 Pending — GEPARMLS
- 2026-04-13 Listed $194,700 GEPARMLS
- 1986-08-26 Sold (Public Records) — Public Records
Property tax history
+4.2%/yrLatest (2025): $3,672 · +10.3% YoY. Source: county tax records.
Cash-flow waterfall
monthlySold comps — $/sqft
last 12 mo · ≤1 miLoading sold comps…