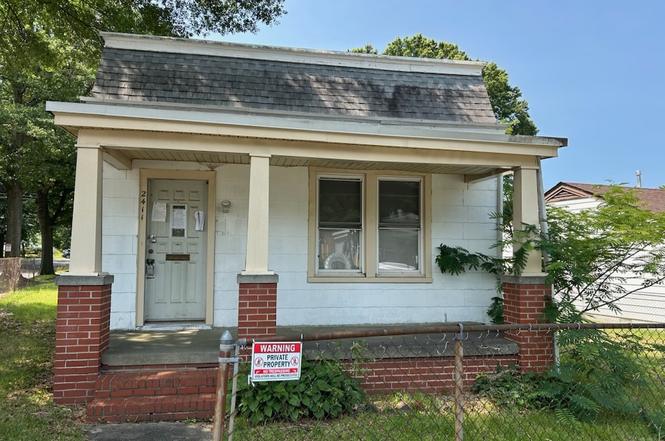
2411 Melbourne St
Richmond, VA 23223
$135,000B-
3 bd · 1.0 ba ·
818 sqft ·
Built 1905
· SingleFamily
· Pending
· 11 DOM
Cashflow @ list (25.0% down · 7.5%)
Estimated rent
$1,481/mo
Mortgage (P&I)
−$708
Tax + insurance
−$130
HOA
−$0
Vac / Maint / Mgmt
−$311
Net cashflow
$332/mo
Annual
$3,980/yr
Cap rate
9.24%
Cash-on-cash
10.53%
DSCR
1.47
1% rule
1.10%
Cash to close
$37,800
Investor read
- This is a 3-bed/1.0-bath single-family listed at $135k.
- At list price, monthly cash flow is $332 ($4k/yr) — positive.
- The deal already cash-flows at list — no discount required.
- Meets the 1% rule at list price ($1k rent vs $135k).
- Only 11 days on market — expect competitive offers; lowballing is unlikely to land.
- Local home prices are declining (-3.0%/yr); year-one equity from $933 of loan paydown is wiped out by about $4k of value loss. Plan a longer hold.
- Location reads 84/100 on livability (#33 in VA, #793 nationally) — a professional / high-income tenant draw. Strengths: amenities A+, commute A+, health & safety A+; Watch: crime D-.
- Richmond City Public School District (urban): math 32% / reading 47% proficiency, ranked #123 of 131 in VA (top 94%) — families likely to look elsewhere, expect single-tenant / working-renter base with shorter leases; 74% free/reduced lunch — lower-income household profile, screen leases tightly.
- Zoned schools: Fairfield Court Elementary (math 24% / reading 24%, grade F, #1,051 of 1,108 statewide, top 96%, 251 students, 98% FRL); Martin Luther King Jr. Middle (math 4% / reading 7%, grade F, #342 of 342 statewide, top 100%, 501 students, 96% FRL); Armstrong High (math 12% / reading 54%, grade F, #316 of 319 statewide, top 99%, 747 students, 90% FRL) — zoned schools average 95% FRL vs 74% district-wide (21 pts higher); higher-poverty schools than district average — tighter screening recommended.
- Zoned-school proficiency averages 21% at this address vs 40% district-wide (-18 pts) — the specific schools serving this property underperform the Richmond City Public School District average; the district grade overstates school quality for this exact location.
- Watch-outs: built in 1905 — expect roof / HVAC / electrical / plumbing capex.
- Market conditions: Rents rising fast (+6.4%/yr); 343 active listings in the ZIP; 40 comparable units currently listed for rent nearby; rentals at typical pace (median 26d on market — plan ~3-4 weeks tenant-placement turnaround); 2,540 units permitted in Richmond city in 2024 (2,077 in 5+ unit buildings).
- Richmond County population projected at +40% by 2050 — long-run rental-demand tailwind backs the buy-and-hold thesis.
- 3 sale attempts since 16y ago; this cycle's ask has dropped $60k (31%) from the opening price — seller is motivated, your offer sets the floor, not the list.
- Current owner paid $36k; list at $135k implies a 275% gain — meaningful room to come down on a strong offer.
- At projected returns (-3.0% appreciation + 6.4% rent growth), your $38k cash investment doubles in ~8 years — after that, you're playing with house money.
- Climate carrying-cost: major wind risk, 27% chance of damaging wind over 30y; extreme-heat days projected 7→16/yr by 2055 (HVAC capex compounding) — expect insurance premiums to compound above CPI over the hold.
- Cap rate 9.2% vs local median 3.2% in Richmond — top-decile yield for the area; either an underpriced asset or a hidden risk that comps aren't pricing in. Stress-test before assuming the spread holds.
Questions for listing agent
- Built in 1905 — when were the roof, HVAC, electrical panel, plumbing, and water heater last replaced?
- Is there a deadline driving the sale (1031 exchange, divorce, estate, relocation)? That informs how much negotiation room exists.
- Schools are A-rated — typically a magnet for longer-tenancy family renters. What's the average tenant stay here, and is there a school-zone premium baked into asking?
- Crime grade is D in this area — have there been break-ins, vandalism, or insurance claims at this property in the last 3 years? What carrier currently insures it and at what premium?
- What's the average days-on-market for RENTAL listings here right now (not sales)? A rising rental-DOM trend means longer vacancies and softer asking-rent achievability than the comps imply.
- What's the recent tenant-quality profile in this submarket — average credit score on applications, eviction rate, late-payment / NSF rate, and stable-employment percentage? A property-management company in the area should have these aggregated.
- How much new for-sale + rental construction is in the pipeline within 1–3 miles? Heavy new supply typically softens prices + rents 12–24 months out; constrained supply supports both.
CashFlowRE · CFR-5026M6BG8R3ZKH
· Data 4 weeks ago
cashflowre.app · 2026-05-29