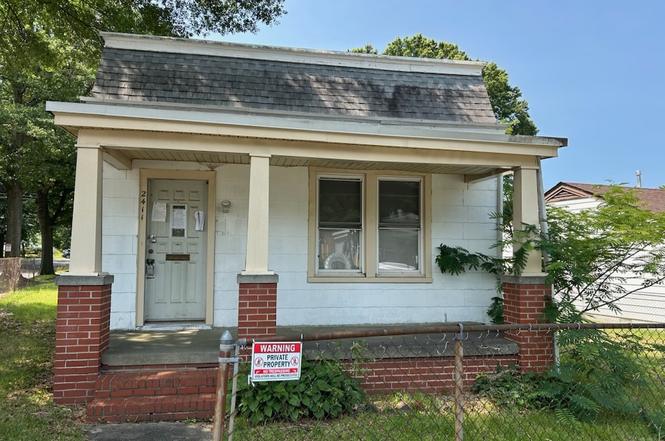
2411 Melbourne St · Richmond, VA
Flood risk 1/10 · Minimal
- FEMA flood zone
- X (unshaded)
- Chance of flooding over 30 yrs
- 0.0%
- Est. flood insurance / yr
- $507 – $1,088
Fire risk 1/10 · Minimal
- Est. fire insurance / yr
- $666 – $1,236
Heat risk 7/10 · Major
- Hot days now (above 105°F)
- 7 days/yr
- Hot days in 30 yrs
- 16 days/yr
Wind risk 6/10 · Moderate
- Chance of severe wind over 30 yrs
- 27.0%
Air-quality risk 2/10 · Minimal
- Unhealthy air days now
- 1 days/yr
- Unhealthy air days in 30 yrs
- 3 days/yr
Risk factors via First Street. Map © Google.
Why this score? — see what drove the B- grade
The composite is a weighted blend of 9 inputs, each scored 0–100. Each bar is that input's sub-score; the figure is the points it added to the 100-point composite (weight × sub-score).
- Cash flow +25.9/30.0
- ARV discount +15.0/15.0
- DSCR +8.7/10.0
- 1% rule +6.0/10.0
- Livability +4.2/5.0
- Rent growth +4.1/5.0
- Schools +3.3/10.0
- Condition / age +2.5/5.0
- Appreciation +0.0/10.0
$135,000
🖨 Deal sheet (PDF) 📄 Offer letter ✓ Due diligence
Listing remarks MLS
2 bedroom on corner lot with detached shed. Hardwood Floors
Key facts
- 6,751 sq ft lot
- Built 1905
- Listed 11 days
Neighborhood map
What this means for you Summary
Snapshot
- This is a 3-bed/1.0-bath single-family listed at $135k.
Deal economics
- At list price, monthly cash flow is $332 ($4k/yr) — positive.
- The deal already cash-flows at list — no discount required.
- Meets the 1% rule at list price ($1k rent vs $135k).
- Cap rate 9.2% vs local median 3.2% in Richmond — top-decile yield for the area; either an underpriced asset or a hidden risk that comps aren't pricing in. Stress-test before assuming the spread holds.
Location & tenants
- Location reads 84/100 on livability (#33 in VA, #793 nationally) — a professional / high-income tenant draw. Strengths: amenities A+, commute A+, health & safety A+; Watch: crime D-.
- Richmond City Public School District (urban): math 32% / reading 47% proficiency, ranked #123 of 131 in VA (top 94%) — families likely to look elsewhere, expect single-tenant / working-renter base with shorter leases; 74% free/reduced lunch — lower-income household profile, screen leases tightly.
- Zoned schools: Fairfield Court Elementary (math 24% / reading 24%, grade F, #1,051 of 1,108 statewide, top 96%, 251 students, 98% FRL); Martin Luther King Jr. Middle (math 4% / reading 7%, grade F, #342 of 342 statewide, top 100%, 501 students, 96% FRL); Armstrong High (math 12% / reading 54%, grade F, #316 of 319 statewide, top 99%, 747 students, 90% FRL) — zoned schools average 95% FRL vs 74% district-wide (21 pts higher); higher-poverty schools than district average — tighter screening recommended.
- Zoned-school proficiency averages 21% at this address vs 40% district-wide (-18 pts) — the specific schools serving this property underperform the Richmond City Public School District average; the district grade overstates school quality for this exact location.
- Market conditions: Rents rising fast (+6.4%/yr); 343 active listings in the ZIP; 40 comparable units currently listed for rent nearby; rentals at typical pace (median 25d on market — plan ~3-4 weeks tenant-placement turnaround); 2,540 units permitted in Richmond city in 2024 (2,077 in 5+ unit buildings).
Forward outlook
- Local home prices are declining (-3.0%/yr); year-one equity from $933 of loan paydown is wiped out by about $4k of value loss. Plan a longer hold.
- Richmond County population projected at +40% by 2050 — long-run rental-demand tailwind backs the buy-and-hold thesis.
- At projected returns (-3.0% appreciation + 6.4% rent growth), your $38k cash investment doubles in ~8 years — after that, you're playing with house money.
Negotiation context
- Only 11 days on market — expect competitive offers; lowballing is unlikely to land.
- 3 sale attempts since 16y ago; this cycle's ask has dropped $60k (31%) from the opening price — seller is motivated, your offer sets the floor, not the list.
- Current owner paid $36k; list at $135k implies a 275% gain — meaningful room to come down on a strong offer.
Risks & watch-outs
- Watch-outs: built in 1905 — expect roof / HVAC / electrical / plumbing capex.
- Climate carrying-cost: major wind risk, 27% chance of damaging wind over 30y; extreme-heat days projected 7→16/yr by 2055 (HVAC capex compounding) — expect insurance premiums to compound above CPI over the hold.
Questions for the listing agent
- Built in 1905 — when were the roof, HVAC, electrical panel, plumbing, and water heater last replaced?
- Is there a deadline driving the sale (1031 exchange, divorce, estate, relocation)? That informs how much negotiation room exists.
- Schools are A-rated — typically a magnet for longer-tenancy family renters. What's the average tenant stay here, and is there a school-zone premium baked into asking?
- Crime grade is D in this area — have there been break-ins, vandalism, or insurance claims at this property in the last 3 years? What carrier currently insures it and at what premium?
- What's the average days-on-market for RENTAL listings here right now (not sales)? A rising rental-DOM trend means longer vacancies and softer asking-rent achievability than the comps imply.
- What's the recent tenant-quality profile in this submarket — average credit score on applications, eviction rate, late-payment / NSF rate, and stable-employment percentage? A property-management company in the area should have these aggregated.
- How much new for-sale + rental construction is in the pipeline within 1–3 miles? Heavy new supply typically softens prices + rents 12–24 months out; constrained supply supports both.
Investment metrics
- 1% rule
- 1.10% ✓
- Cap rate
- 9.24%
- Cash-on-cash
- 10.53%
- DSCR
- 1.47
- GRM
- 7.6
CMA / ARV
- ARV (on-the-fly)
- $178,324
- Comps found
- 12
Show comp detail 12 sales within ~0.75 mi
| Address | Dist | Beds/Ba | Sqft | Sold | Price | $/sf | Match |
|---|---|---|---|---|---|---|---|
| 2003 N 20th St | 0.34mi | 3/1.0 | 804 (-2%) | 4mo | $199,900 | $249 | 78 |
| 2100 Wood St | 0.26mi | 3/1.0 | 862 (+5%) | 6mo | $203,000 | $235 | 74 |
| 2117 Selden St | 0.47mi | 3/1.0 | 796 (-3%) | 2mo | $190,000 | $239 | 72 |
| 1508 N 20th St | 0.47mi | 2/1.0 (-1) | 816 (-0%) | 6mo | $235,000 | $288 | 68 |
| 1906 Maddox St | 0.14mi | 2/1.0 (-1) | 912 (+12%) | 2mo | $198,500 | $218 | 67 |
| 2511 Redwood | 0.07mi | 2/1.0 (-1) | 698 (-15%) | 0mo | $108,000 | $155 | 67 |
| 1801 N 19th St | 0.27mi | 2/1.5 (-1) | 870 (+6%) | 7mo | $224,500 | $258 | 64 |
| 2502 Redwood Ave | 0.04mi | 2/1.0 (-1) | 698 (-15%) | 7mo | $145,000 | $208 | 63 |
| 2013 Cool Ln | 0.46mi | 2/1.0 (-1) | 761 (-7%) | 1mo | $160,000 | $210 | 61 |
| 1429 Rogers St | 0.42mi | 2/1.0 (-1) | 893 (+9%) | 3mo | $179,000 | $200 | 57 |
| 1602 N 24th St | 0.67mi | 3/1.0 | 898 (+10%) | 3mo | $157,000 | $175 | 50 |
| 2503 Peter Paul Blvd | 0.72mi | 2/1.0 (-1) | 720 (-12%) | 8mo | $150,000 | $208 | 34 |
Match score weights: distance 35% · size 25% · config 20% · recency 20%. Top-matched comps best support the ARV.
Projected returns pro-forma
-3.0% appreciation · 6.38% rent growth · sell at horizon
- IRR
- 2.9%
- Equity multiple
- 1.12×
- Total profit
- $4,421
- Equity at exit
- $20,129
- IRR
- 15.3%
- Equity multiple
- 2.42×
- Total profit
- $53,812
- Equity at exit
- $11,672
Cash invested: $37,800 (down + closing). Projections, not guarantees.
Landlord ↔ Tenant lean methodology
- Overall (STATE)
- 55 Moderately Landlord-Leaning
- State Virginia
- 55 Moderately Landlord-Leaning · D+2
- County
- — inherits STATE
- City
- — inherits STATE
ZIP-level market 23223
- Rents YoY
- 6.4%
- Active inventory
- 343
- Price-to-rent
- 7.6×
Monthly cashflow live
- Estimated rent
- $1,481 high interval (Pro) →
- Mortgage (P&I)
- −$708
- Tax from tax record
- −$74 /mo · $888/yr
- Insurance
- −$56
- HOA
- −$0
- Vacancy / Maint / Mgmt
- −$311
- Net cashflow
- $332
Break-even live
Sensitivity live
| Price | -10% $408 | -5% $370 | +0% $332 | +5% $293 | +10% $255 |
|---|---|---|---|---|---|
| Rent | -10% $215 | -5% $273 | +0% $332 | +5% $390 | +10% $449 |
| Rate | -1.0pp $400 | -0.5pp $366 | base $332 | +0.5pp $297 | +1.0pp $261 |
UW: 25.0% down · 7.5% · 30yr · 1.5% tax · 5.0% vac · 8.0% maint · 8.0% mgmt
Financing live
Cash to close
- Down payment
- $33,750
- Closing costs
- $4,050
- Reserves months
- —
- Total cash needed
- —
Loan-product check · same deal, 3 products live
Conventional
25% down · 7.5% · 30yr
- Down + closing
- —
- Monthly P&I
- —
- Monthly cashflow
- —
- DSCR
- —
- Eligible?
- —
Personal DTI + credit; lowest rate.
DSCR
20% down · 8.5% · 30yr
- Down + closing
- —
- Monthly P&I
- —
- Monthly cashflow
- —
- DSCR
- —
- Eligible?
- —
No personal income docs; deal must DSCR.
Hard money
10% down · 12.0% · 12mo
- Down + closing
- —
- Monthly P&I
- —
- Monthly cashflow
- —
- DSCR
- —
- Eligible?
- —
Short-term bridge; refi at stabilization.
Rent comps 40 comps
| Address | Beds | Baths | Sqft | Rent | $/sqft | DOM | Units | Dist |
|---|---|---|---|---|---|---|---|---|
| 2423 Whitcomb St Richmond, VA | 3.0 | 1.0 | 1000 | $1,100 | $1.10 | 25d | 1 | 0.15mi |
| 2106 Wood St Richmond, VA | 3.0 | 1.0 | 862 | $1,814 | $2.10 | 21d | 1 | 0.25mi |
| 2021 Fairfield Ave Richmond, VA | 2.0 | 1.0 | 785 | $1,195 | $1.52 | 16d | 1 | 0.38mi |
| 1901 Whitcomb St Richmond, VA | 2.0 | 1.0 | 750 | $1,200 | $1.60 | 25d | 1 | 0.39mi |
| 2100 Phaup St Richmond, VA | 2.0 | 1.0 | 800 | $995 | $1.24 | 25d | 1 | 0.43mi |
| 2108 Phaup St Unit D Richmond, VA | 2.0 | 1.0 | 700 | $995 | $1.42 | 25d | 1 | 0.46mi |
| 2016 Fairmount Ave Apt 2 Richmond, VA | 2.0 | 1.0 | 1000 | $1,007 | $1.01 | 16d | 1 | 0.64mi |
| 2016 Fairmount Ave Apt 2 Richmond, VA | 2.0 | 1.0 | 1000 | $1,007 | $1.01 | 45d | 1 | 0.64mi |
| 1108 N 21st St Unit B Richmond, VA | 2.0 | 2.0 | 1000 | $1,799 | $1.80 | 4d | 1 | 0.74mi |
| 2200 Carrington St Unit 300 Richmond, VA | 2.0 | 2.0 | 880 | $1,435 | $1.63 | 45d | 1 | 0.86mi |
| 2200 Carrington St Unit 301 Richmond, VA | 2.0 | 2.0 | 890 | $1,435 | $1.61 | 17d | 1 | 0.86mi |
| 2706 Selden St Richmond, VA | 3.0 | 1.0 | 862 | $1,895 | $2.20 | 45d | 1 | 0.87mi |
| 1906 N 29th St Richmond, VA | 2.0 | 1.0 | 704 | $1,000 | $1.42 | 6d | 1 | 0.92mi |
| 2906 Nine Mile Rd Richmond, VA | 2.0 | 1.0 | 885 | $1,845 | $2.08 | 25d | 1 | 0.97mi |
| 1603 N 29th St Richmond, VA | 3.0 | 1.0 | 950 | $1,600 | $1.68 | 6d | 1 | 0.97mi |
| 306 St Claire Ln Richmond, VA | 3.0 | 1.0 | 1017 | $1,595 | $1.57 | 4d | 1 | 0.99mi |
| 200 Minor St Unit A Richmond, VA | 3.0 | 1.0 | 1100 | $1,295 | $1.18 | 25d | 1 | 1.03mi |
| 2852 Fairfield Ave Richmond, VA | 2.0–3.0 | 1.0 | 870 | $1,350 | $1.55 | 6d | 1 | 1.07mi |
| 2000 Lamb Ave Apt C Richmond, VA | 2.0 | 1.0 | 750 | $1,295 | $1.73 | 45d | 1 | 1.07mi |
| 500 N 18th St Richmond, VA | 1.0–2.0 | 1.0–2.0 | 737 | $1,837 | $2.49 | 3d | 11 | 1.08mi |
| 2919 4th Ave #2 Richmond, VA | 2.0 | 2.0 | 950 | $1,287 | $1.35 | 45d | 1 | 1.13mi |
| 2810 2nd Ave Richmond, VA | 2.0 | 1.0 | 1120 | $1,950 | $1.74 | 45d | 1 | 1.14mi |
| 1910 North Ave Richmond, VA | 3.0 | 1.0 | 1010 | $1,595 | $1.58 | 12d | 1 | 1.17mi |
| 3119 4th Ave Richmond, VA | 2.0 | 1.0 | 820 | $1,225 | $1.49 | 18d | 1 | 1.22mi |
| 700 N 2nd St Unit 203 Richmond, VA | 2.0 | 1.0 | 690 | $1,250 | $1.81 | 45d | 1 | 1.22mi |
| 1820 E Broad St Richmond, VA | 1.0–2.0 | 1.0–2.0 | 665 | $2,476 | $3.72 | 22d | 15 | 1.23mi |
| 1903 E Marshall St Richmond, VA | 3.0 | 1.0–2.0 | 723 | $1,799 | $2.49 | 3d | 57 | 1.23mi |
| 2400 Barton Ave Richmond, VA | 2.0 | 1.0 | 813 | $1,245 | $1.53 | 6d | 2 | 1.28mi |
| 15 N 18th St Richmond, VA | 2.0 | 2.0 | 852 | $1,438 | $1.69 | 16d | 2 | 1.29mi |
| 2416 Barton Ave Apt 2 Richmond, VA | 2.0 | 1.0 | 1000 | $1,150 | $1.15 | 45d | 1 | 1.31mi |
| 403 Fritz St Richmond, VA | 2.0 | 1.0 | 1000 | $1,595 | $1.59 | 45d | 1 | 1.32mi |
| 2001 E Broad St Richmond, VA | 1.0–2.0 | 1.0–2.0 | 835 | $1,790 | $2.14 | 3d | 4 | 1.32mi |
| 2420 Barton Ave Apt 2 Richmond, VA | 2.0 | 1.0 | 900 | $1,150 | $1.28 | 25d | 1 | 1.33mi |
| 1606 Fendall Ave Richmond, VA | 2.0 | 1.0 | 825 | $1,349 | $1.64 | 45d | 1 | 1.33mi |
| 1610 Fendall Ave Richmond, VA | 2.0 | 1.0 | 825 | $1,249 | $1.51 | 45d | 1 | 1.33mi |
| 417 Fritz St Richmond, VA | 2.0 | 1.0 | 725 | $1,295 | $1.79 | 45d | 1 | 1.34mi |
| 1605 Hickory St Richmond, VA | 2.0 | 1.0 | 825 | $1,249 | $1.51 | 45d | 1 | 1.35mi |
| 1611 Hickory St Richmond, VA | 2.0 | 1.0 | 825 | $1,449 | $1.76 | 45d | 1 | 1.36mi |
| 1508 Hickory St Richmond, VA | 2.0 | 1.0 | 725 | $1,195 | $1.65 | 45d | 1 | 1.36mi |
| 220 E Marshall St Apt 34 Richmond, VA | 2.0 | 2.0 | 914 | $1,650 | $1.81 | 3d | 1 | 1.37mi |
Listing history 8 events
-
2025-09-04status Pending
-
2025-08-25status Active
-
2025-08-25price $135,000
-
2025-06-20$195,000 Active
-
2010-04-27soldstatus $36,000 59-char remark
Show marketing remark (59 chars)
2 bedroom on corner lot with detached shed. Hardwood Floors
-
2010-04-07historical 59-char remark
Show marketing remark (59 chars)
2 bedroom on corner lot with detached shed. Hardwood Floors
-
2010-01-27$37,500 59-char remark
Show marketing remark (59 chars)
2 bedroom on corner lot with detached shed. Hardwood Floors
-
2006-03-27soldstatus $40,000
ⓘ Source: listings_history table (triggers on properties + properties_extension) + one-shot
backfill from property_details.listing_events for pre-trigger history.
Tax reassessment forecast VA · Resets to sale price
- Current annual tax
- $888 · $74/mo
- Projected year-2 tax
- $1,107 · $92/mo
- Expected delta
- +$219/yr (+$18/mo · 24.7%)
ⓘ Screening estimate from a state-policy table — verify with the county assessor before closing.
Climate risk First Street
- Flood 1/10 Low FEMA zone X (unshaded) · 0% chance over 30 yrs
- Wildfire 1/10 Low
- Heat 7/10 Severe 7 d/yr ≥105°F today · 16 d/yr by 30 yrs out
- Wind 6/10 Major 27% chance of damaging wind over 30 yrs
- Air quality 2/10 Low 1 unhealthy d/yr today · 3 by 30 yrs out
Nearby sold comps map
Loading sold comps map…
Walkable amenities ~0.75 mi
Loading nearby amenities…
Taxation est. · year 1
- Rental income
- $17,771
- − Mortgage interest
- −$7,562
- − Property taxes
- −$888
- − Insurance
- −$675
- − Repairs & maintenance
- −$1,422
- − Management
- −$1,422
- − Depreciation
- −$3,927
- Taxable income
- $1,875
- Est. tax owed @ 24.0%
- −$450
- After-tax cash flow
- $3,530/yr
For passive investors: Depreciation is non-cash, so a rental often shows a tax loss while cash-flowing — sheltering income. Rental losses are passive: they offset passive income freely, and up to $25,000/yr can offset ordinary (W-2) income if you actively participate and your MAGI is under $100k (phasing out to $0 by $150k); unused losses carry forward. On sale, claimed depreciation is recaptured at up to 25%, and gains may owe capital-gains tax (a 1031 exchange can defer both). Figures are a year-1 estimate at your 24.0% rate — not tax advice; consult a CPA.
Schools (NCES district)
- District
- Richmond City Public School District
- NCES district ID
- 5103240
- Math proficiency
- 32% ▼ -24.00%
- Reading proficiency
- 47% ▼ -9.00%
- Median HH income
- $40,276
- Composite
- 33.09/100
- National rank
- #5564
- State rank
- #123 of 131 in VA
Livability — Richmond
- Score
- 84/100
- State rank
- #33
- US rank
- #793
Category grades
Schools grade is shown separately in the Schools card above.
Census & demographics
- Census place
- Richmond, VA
- County
- Henrico County · 334,490 people
- City population
- 287,109
- Metro
- Richmond, VA
- Population (ZIP)
- 54,659
- Household income
- $55,731
- Rent vs Own
- Severe rent burden
- 3530.0
Population outlook (Richmond County) Hauer SSP2
- Today (2025)
- 262,263 people
- By 2030
- 284,503 · +8.5%
- By 2040
- 327,353 · +24.8%
- By 2050
- 367,946 · +40.3%
- By 2075
- 449,560 · +71.4%
- By 2100
- 500,301 · +90.8%
Race, ethnicity, and origin ACS 2023
- Neighborhood character
- Predominantly Black (71%)
- Race & ethnicity
- Black 71% White 19% Two or more races 5% Hispanic / Latino 5%
- Common ancestry
- Romanian 1% Lithuanian 1% Slovak 1%
- Foreign-born
- 4% · Canada
- Languages at home
- 93% English-only · Spanish 4% French/Haitian/Cajun 1% Other Indo-European 1%
Political lean MEDSL · Richmond
- 2024 margin
- Solid D (+66.3) · D 82.0% · R 15.8% · Other 2.2%
- 2008→2024 swing
- +7.2pp toward D · 2008: 59.1pp · 2024: 66.3pp
- All cycles
- 2024: D+66.3 2020: D+68.0 2016: D+63.8 2012: D+55.7 2008: D+59.1
Not yet ingested
- Civics
- —
Market trends
- HPI YoY
- ▼ -257.81%
- Current HPI
- 324.0589
- Rent YoY
- ▲ 6.38%
- Metro
- Richmond, VA
- State GDP YoY
- ▲ 2.40%
- F500 in state
- 50
Industry mix (Fortune 500 HQ in VA)
| Industry | F500 HQs | Revenue |
|---|---|---|
| Aerospace / Defense | 4 | $236B |
|
||
| Technology / Defense | 3 | $32B |
|
||
| Financial Services | 2 | $176B |
|
||
| Utilities | 2 | $27B |
|
||
| Insurance | 2 | $25B |
|
||
| Technology | 2 | $15B |
|
||
Price history
+237.5% since first listed8 events — show timeline
- 2025-09-04 Pending — CVRMLS
- 2025-08-25 Relisted — CVRMLS
- 2025-08-25 Price Changed $135,000 CVRMLS
- 2025-06-20 Listed $195,000 CVRMLS
- 2010-04-27 Sold (MLS) $36,000 CVRMLS
- 2010-04-07 Listing Removed — CVRMLS
- 2010-01-27 Listed $37,500 CVRMLS
- 2006-03-27 Sold (Public Records) $40,000 Public Records
Property tax history
+3.8%/yrLatest (2022): $888 · +29.8% YoY. Source: county tax records.
Cash-flow waterfall
monthlySold comps — $/sqft
last 12 mo · ≤1 miLoading sold comps…