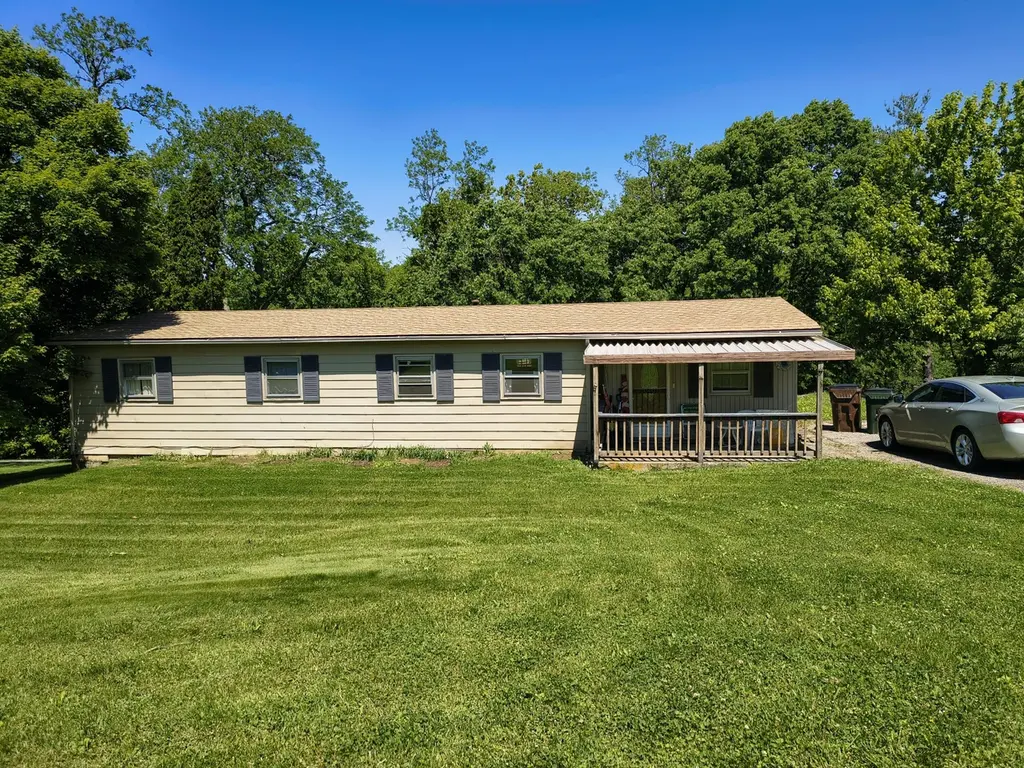
2976 Senour Rd
Covington, KY 41051
$239,000C
3 bd · 2.0 ba ·
1,444 sqft ·
Built 1971
· SingleFamily
· Active
· 26 DOM
Cashflow @ list (25.0% down · 7.5%)
Estimated rent
$2,163/mo
Mortgage (P&I)
−$1,253
Tax + insurance
−$238
HOA
−$0
Vac / Maint / Mgmt
−$454
Net cashflow
$217/mo
Annual
$2,601/yr
Cap rate
7.38%
Cash-on-cash
3.89%
DSCR
1.17
1% rule
0.90%
Cash to close
$66,920
Investor read
- This is a 3-bed/2.0-bath single-family listed at $239k.
- At list price, monthly cash flow is $217 ($3k/yr) — positive.
- The deal already cash-flows at list — no discount required.
- To meet the 1% rule (rent ≥ 1% of price), the offer needs to be $216k (9.5% below list).
- It's been on market 26 days — a 2% lower offer ($235k) is reasonable based on typical stale-listing flexibility.
- Recommended offer: $216k (9.5% below list) — sets the bar for 1% rule.
- Local home prices are declining (-3.0%/yr); year-one equity from $2k of loan paydown is wiped out by about $7k of value loss. Plan a longer hold.
- Location reads 86/100 on livability (#40 in KY, #376 nationally) — a professional / high-income tenant draw. Strengths: amenities A+, commute A+, cost of living A+; Watch: employment D+.
- Kenton County (suburban): math 42% / reading 48% proficiency, ranked #14 of 165 in KY (top 8%) — families likely to look elsewhere, expect single-tenant / working-renter base with shorter leases.
- Zoned schools: Kenton Elementary School (math 59% / reading 52%, grade C, #60 of 676 statewide, top 9%, 627 students, 42% FRL); Twenhofel Middle School (math 33% / reading 47%, grade F, #59 of 217 statewide, top 29%, 835 students, 39% FRL); Scott High School (math 33% / reading 33%, grade F, #94 of 254 statewide, top 37%, 1,071 students, 42% FRL).
- Market conditions: Rents rising fast (+5.4%/yr); 258 active listings in the ZIP; solid renter incomes; 699 units permitted in Kenton County in 2024 (287 in 5+ unit buildings).
- Kenton County population projected at +5% by 2050 — modest demand growth; plan on rents tracking national, not racing it.
- 3 sale attempts since 16y ago with the ask held roughly flat each time — persistent listings suggest the price (not the market) is what's stuck; bring a comps-based counter.
- Current owner paid $64k; list at $239k implies a 274% gain — meaningful room to come down on a strong offer.
- Cap rate 7.4% vs local median 5.3% in Covington — top-decile yield for the area; either an underpriced asset or a hidden risk that comps aren't pricing in. Stress-test before assuming the spread holds.
Questions for listing agent
- Built in 1971 — when were the roof, HVAC, electrical panel, plumbing, and water heater last replaced?
- Is there a deadline driving the sale (1031 exchange, divorce, estate, relocation)? That informs how much negotiation room exists.
- What's the average days-on-market for RENTAL listings here right now (not sales)? A rising rental-DOM trend means longer vacancies and softer asking-rent achievability than the comps imply.
- What's the recent tenant-quality profile in this submarket — average credit score on applications, eviction rate, late-payment / NSF rate, and stable-employment percentage? A property-management company in the area should have these aggregated.
- How much new for-sale + rental construction is in the pipeline within 1–3 miles? Heavy new supply typically softens prices + rents 12–24 months out; constrained supply supports both.
CashFlowRE · CFR-5031KS1E91DZW9
· Data 14 h ago
cashflowre.app · 2026-05-29