2976 Senour Rd · Covington, KY
Flood risk 1/10 · Minimal
- FEMA flood zone
- X (unshaded)
- Chance of flooding over 30 yrs
- 0.0%
- Est. flood insurance / yr
- $507 – $1,088
Fire risk 2/10 · Minimal
- Est. fire insurance / yr
- $839 – $1,559
Heat risk 4/10 · Minor
- Hot days now (above 102°F)
- 7 days/yr
- Hot days in 30 yrs
- 19 days/yr
Wind risk 2/10 · Minimal
- Chance of severe wind over 30 yrs
- 1.0%
Air-quality risk 3/10 · Minor
- Unhealthy air days now
- 2 days/yr
- Unhealthy air days in 30 yrs
- 3 days/yr
Risk factors via First Street. Map © Google.
Why this score? — see what drove the C grade
The composite is a weighted blend of 9 inputs, each scored 0–100. Each bar is that input's sub-score; the figure is the points it added to the 100-point composite (weight × sub-score).
- Cash flow +18.3/30.0
- ARV discount +15.0/15.0
- DSCR +5.7/10.0
- Livability +4.3/5.0
- 1% rule +4.0/10.0
- Schools +4.0/10.0
- Rent growth +3.8/5.0
- Condition / age +2.5/5.0
- Appreciation +0.0/10.0
$239,000
🖨 Deal sheet (PDF) 📄 Offer letter ✓ Due diligence
Listing remarks
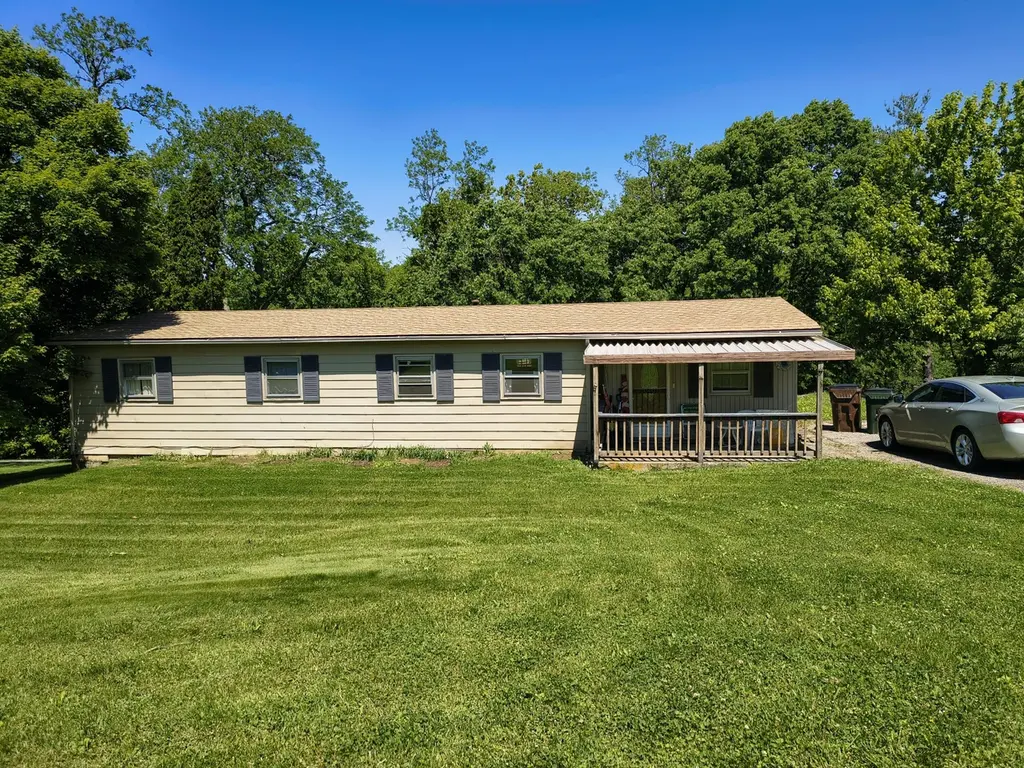
Move in ready ranch home on almost an acre in highly desirable location!!This spacious 3 bedroom, 2 bath home offers comfortable one level living with open and functional floor plan. Enjoy the peaceful setting with plenty of room for outdoor activites, gardening, or entertaining. Conveniently located near shopping, dining, schools, and major routes while still providing the privacy and space you've been looking for . a fantastic opportunity for homeowners seeking country-style living but close in
Key facts
- Ranch home
- Open floor plan
- Peaceful setting
Tags
Property features AI
Exterior
- Parking: Off-street parking
- Utilities: Public water; Septic tank; Cable available
- Home design: Single family residence; Modular home; One level
- Construction: Built in 1971; Aluminum siding; Asphalt shingle roof; Block foundation
- Exterior features: Cleared lot; Partially wooded; Shed(s); Paved road frontage on a county road
Interior
- Kitchen: Gas range; Dishwasher; Refrigerator
- Bedrooms: Primary bedroom on main level (23 x 11); Additional bedroom on main level (10 x 8)
- Bathrooms: 2 full bathrooms
- Heating & cooling: Central air conditioning; Forced air heating
- Interior features: Living room (22 x 14); Dining room (11 x 8); Primary bedroom (23 x 11); Bedroom (10 x 8); Second bathroom (11 x 8); Kitchen (10 x 8)
- Laundry & utility: Washer and dryer included; Laundry on main level
Neighborhood map
What this means for you Summary
Snapshot
- This is a 3-bed/2.0-bath single-family listed at $239k.
Deal economics
- At list price, monthly cash flow is $217 ($3k/yr) — positive.
- The deal already cash-flows at list — no discount required.
- To meet the 1% rule (rent ≥ 1% of price), the offer needs to be $216k (9.5% below list).
- Recommended offer: $216k (9.5% below list) — sets the bar for 1% rule.
- Cap rate 7.4% vs local median 5.3% in Covington — top-decile yield for the area; either an underpriced asset or a hidden risk that comps aren't pricing in. Stress-test before assuming the spread holds.
Location & tenants
- Location reads 86/100 on livability (#40 in KY, #376 nationally) — a professional / high-income tenant draw. Strengths: amenities A+, commute A+, cost of living A+; Watch: employment D+.
- Kenton County (suburban): math 42% / reading 48% proficiency, ranked #14 of 165 in KY (top 8%) — families likely to look elsewhere, expect single-tenant / working-renter base with shorter leases.
- Zoned schools: Kenton Elementary School (math 59% / reading 52%, grade C, #60 of 676 statewide, top 9%, 627 students, 42% FRL); Twenhofel Middle School (math 33% / reading 47%, grade F, #59 of 217 statewide, top 29%, 835 students, 39% FRL); Scott High School (math 33% / reading 33%, grade F, #94 of 254 statewide, top 37%, 1,071 students, 42% FRL).
- Market conditions: Rents rising fast (+5.4%/yr); 257 active listings in the ZIP; solid renter incomes; 699 units permitted in Kenton County in 2024 (287 in 5+ unit buildings).
Forward outlook
- Local home prices are declining (-3.0%/yr); year-one equity from $2k of loan paydown is wiped out by about $7k of value loss. Plan a longer hold.
- Kenton County population projected at +5% by 2050 — modest demand growth; plan on rents tracking national, not racing it.
Negotiation context
- It's been on market 26 days — a 2% lower offer ($235k) is reasonable based on typical stale-listing flexibility.
- 3 sale attempts since 16y ago with the ask held roughly flat each time — persistent listings suggest the price (not the market) is what's stuck; bring a comps-based counter.
- Current owner paid $64k; list at $239k implies a 274% gain — meaningful room to come down on a strong offer.
Questions for the listing agent
- Built in 1971 — when were the roof, HVAC, electrical panel, plumbing, and water heater last replaced?
- Is there a deadline driving the sale (1031 exchange, divorce, estate, relocation)? That informs how much negotiation room exists.
- What's the average days-on-market for RENTAL listings here right now (not sales)? A rising rental-DOM trend means longer vacancies and softer asking-rent achievability than the comps imply.
- What's the recent tenant-quality profile in this submarket — average credit score on applications, eviction rate, late-payment / NSF rate, and stable-employment percentage? A property-management company in the area should have these aggregated.
- How much new for-sale + rental construction is in the pipeline within 1–3 miles? Heavy new supply typically softens prices + rents 12–24 months out; constrained supply supports both.
Investment metrics
- 1% rule
- 0.90% ✗
- Cap rate
- 7.38%
- Cash-on-cash
- 3.89%
- DSCR
- 1.17
- GRM
- 9.2
CMA / ARV
- ARV (on-the-fly)
- $294,576
- Comps found
- 12
Show comp detail 12 sales within ~0.75 mi
| Address | Dist | Beds/Ba | Sqft | Sold | Price | $/sf | Match |
|---|---|---|---|---|---|---|---|
| 3068 Saddlebred Ct | 0.31mi | 3/2.0 | 1,449 (+0%) | 5mo | $295,000 | $204 | 80 |
| 3118 Bridlerun Dr | 0.41mi | 3/2.5 | 1,436 (-1%) | 5mo | $272,400 | $190 | 74 |
| 3104 Bridlerun Dr | 0.39mi | 3/2.5 | 1,368 (-5%) | 8mo | $267,750 | $196 | 64 |
| 170 Beaver Ct | 0.68mi | 3/3.0 | 1,492 (+3%) | 2mo | $335,000 | $225 | 57 |
| 3140 Summitrun Dr | 0.51mi | 3/2.0 | 1,329 (-8%) | 8mo | $269,900 | $203 | 57 |
| 3047 Saddlebred Ct | 0.27mi | 3/2.0 | 1,320 (-9%) | 22mo | $320,000 | $242 | 55 |
| 9738 Cloveridge Dr | 0.45mi | 4/2.5 (+1) | 1,603 (+11%) | 3mo | $300,000 | $187 | 51 |
| 3163 Summitrun Dr | 0.58mi | 3/2.5 | 1,312 (-9%) | 11mo | $285,800 | $218 | 47 |
| 3185 Meadoway Ct | 0.60mi | 3/2.5 | 1,603 (+11%) | 9mo | $280,000 | $175 | 44 |
| 3124 Summitrun Dr | 0.50mi | 3/2.5 | 1,236 (-14%) | 14mo | $268,000 | $217 | 39 |
| 3433 Senour Rd | 0.74mi | 3/2.0 | 1,562 (+8%) | 20mo | $287,000 | $184 | 35 |
| 3252 Summitrun Dr | 0.64mi | 3/2.5 | 1,236 (-14%) | 18mo | $260,000 | $210 | 29 |
Match score weights: distance 35% · size 25% · config 20% · recency 20%. Top-matched comps best support the ARV.
Projected returns pro-forma
-3.0% appreciation · 5.37% rent growth · sell at horizon
- IRR
- -7.8%
- Equity multiple
- 0.71×
- Total profit
- $-19,707
- Equity at exit
- $35,636
- IRR
- 4.3%
- Equity multiple
- 1.35×
- Total profit
- $23,093
- Equity at exit
- $20,664
Cash invested: $66,920 (down + closing). Projections, not guarantees.
Landlord ↔ Tenant lean methodology
- Overall (STATE)
- 83 Strongly Landlord-Friendly
- State Kentucky
- 83 Strongly Landlord-Friendly · R+16
- County
- — inherits STATE
- City
- — inherits STATE
ZIP-level market 41051
- Home prices YoY
- -32.6%
- Rents YoY
- 5.4%
- Active inventory
- 257
- Price-to-rent
- 9.2×
Monthly cashflow live
- Estimated rent
- $2,163 medium interval (Pro) →
- Mortgage (P&I)
- −$1,253
- Tax from tax record
- −$139 /mo · $1,667/yr
- Insurance
- −$100
- HOA
- −$0
- Vacancy / Maint / Mgmt
- −$454
- Net cashflow
- $217
Break-even live
Sensitivity live
| Price | -10% $352 | -5% $284 | +0% $217 | +5% $149 | +10% $81 |
|---|---|---|---|---|---|
| Rent | -10% $46 | -5% $131 | +0% $217 | +5% $302 | +10% $388 |
| Rate | -1.0pp $337 | -0.5pp $278 | base $217 | +0.5pp $155 | +1.0pp $92 |
UW: 25.0% down · 7.5% · 30yr · 1.5% tax · 5.0% vac · 8.0% maint · 8.0% mgmt
Financing live
Cash to close
- Down payment
- $59,750
- Closing costs
- $7,170
- Reserves months
- —
- Total cash needed
- —
Loan-product check · same deal, 3 products live
Conventional
25% down · 7.5% · 30yr
- Down + closing
- —
- Monthly P&I
- —
- Monthly cashflow
- —
- DSCR
- —
- Eligible?
- —
Personal DTI + credit; lowest rate.
DSCR
20% down · 8.5% · 30yr
- Down + closing
- —
- Monthly P&I
- —
- Monthly cashflow
- —
- DSCR
- —
- Eligible?
- —
No personal income docs; deal must DSCR.
Hard money
10% down · 12.0% · 12mo
- Down + closing
- —
- Monthly P&I
- —
- Monthly cashflow
- —
- DSCR
- —
- Eligible?
- —
Short-term bridge; refi at stabilization.
Listing history 20 events
-
2026-06-21days on market $239,000 Active 26 DOM
-
2026-06-18days on market $239,000 Active 23 DOM
-
2026-06-17days on market $239,000 Active 22 DOM
-
2026-06-16days on market $239,000 Active 21 DOM
-
2026-06-15days on market $239,000 Active 20 DOM
-
2026-06-13days on market $239,000 Active 18 DOM
-
2026-06-09days on market $239,000 Active 14 DOM
-
2026-06-08days on market $239,000 Active 13 DOM
-
2026-06-07pricedays on market $239,000 Active 12 DOM
-
2026-06-03days on market $249,000 Active 8 DOM
-
2026-06-02days on market $249,000 Active 7 DOM
-
2026-06-01days on market $249,000 Active 6 DOM
-
2026-05-31days on market $249,000 Active 5 DOM
-
2026-05-26$249,000 Active
-
2012-05-01historical
-
2011-05-03$140,000
-
2011-03-31historical
-
2010-02-24$150,000
-
1996-12-06soldstatus $63,950
-
1996-09-18soldstatus $63,950
ⓘ Source: listings_history table (triggers on properties + properties_extension) + one-shot
backfill from property_details.listing_events for pre-trigger history.
Tax reassessment forecast KY · Resets to sale price
- Current annual tax
- $1,667 · $139/mo
- Projected year-2 tax
- $2,055 · $171/mo
- Expected delta
- +$389/yr (+$32/mo · 23.3%)
ⓘ Screening estimate from a state-policy table — verify with the county assessor before closing.
Climate risk First Street
- Flood 1/10 Low FEMA zone X (unshaded) · 0% chance over 30 yrs
- Wildfire 2/10 Low
- Heat 4/10 Moderate 7 d/yr ≥102°F today · 19 d/yr by 30 yrs out
- Wind 2/10 Low 100% chance of damaging wind over 30 yrs
- Air quality 3/10 Moderate 2 unhealthy d/yr today · 3 by 30 yrs out
Nearby sold comps map
Loading sold comps map…
Walkable amenities ~0.75 mi
Loading nearby amenities…
Taxation est. · year 1
- Rental income
- $25,953
- − Mortgage interest
- −$13,388
- − Property taxes
- −$1,667
- − Insurance
- −$1,195
- − Repairs & maintenance
- −$2,076
- − Management
- −$2,076
- − Depreciation
- −$6,953
- Taxable loss
- −$1,401
- Est. tax savings @ 24.0%
- +$336
- After-tax cash flow
- $2,938/yr
For passive investors: Depreciation is non-cash, so a rental often shows a tax loss while cash-flowing — sheltering income. Rental losses are passive: they offset passive income freely, and up to $25,000/yr can offset ordinary (W-2) income if you actively participate and your MAGI is under $100k (phasing out to $0 by $150k); unused losses carry forward. On sale, claimed depreciation is recaptured at up to 25%, and gains may owe capital-gains tax (a 1031 exchange can defer both). Figures are a year-1 estimate at your 24.0% rate — not tax advice; consult a CPA.
Schools (NCES district)
- District
- Kenton County
- NCES district ID
- 2103090
- Math proficiency
- 42% ▼ -13.00%
- Reading proficiency
- 48% ▼ -14.00%
- Median HH income
- $66,183
- Composite
- 40.17/100
- National rank
- #3789
- State rank
- #14 of 165 in KY
Livability — Covington
- Score
- 86/100
- State rank
- #40
- US rank
- #376
Category grades
Schools grade is shown separately in the Schools card above.
Census & demographics
- Census place
- Covington, KY
- County
- Kenton County · 142,881 people
- City population
- 34,373
- Metro
- Cincinnati, OH-KY-IN
- Population (ZIP)
- 33,054
- Household income
- $104,201
- Rent vs Own
- Severe rent burden
- 243.0
Population outlook (Kenton County) Hauer SSP2
- Today (2025)
- 174,205 people
- By 2030
- 177,897 · +2.1%
- By 2040
- 182,671 · +4.9%
- By 2050
- 183,543 · +5.4%
- By 2075
- 178,977 · +2.7%
- By 2100
- 159,920 · -8.2%
Race, ethnicity, and origin ACS 2023
- Neighborhood character
- Predominantly White (93%)
- Race & ethnicity
- White 93% Two or more races 3% Hispanic / Latino 2% Black 1% Asian 1%
- Common ancestry
- Italian 3% Lithuanian 3% Slovak 2%
- Foreign-born
- 3% · China, Canada
- Languages at home
- 96% English-only · Spanish 1% Chinese 1% Other Asian/Pacific 1%
Political lean MEDSL · Kenton
- 2024 margin
- Strong R (+21.7) · D 38.2% · R 59.9% · Other 1.9%
- 2008→2024 swing
- -0.9pp no change · 2008: -20.9pp · 2024: -21.7pp
- All cycles
- 2024: R+21.7 2020: R+19.3 2016: R+26.1 2012: R+24.3 2008: R+20.9
Not yet ingested
- Civics
- —
Market trends
- HPI YoY
- ▼ -105.60%
- Current HPI
- 218.492
- Rent YoY
- ▲ 5.37%
- Metro
- Cincinnati, OH-KY-IN
- State GDP YoY
- ▲ 1.81%
- F500 in state
- 4
Industry mix (Fortune 500 HQ in KY)
| Industry | F500 HQs | Revenue |
|---|---|---|
| Healthcare | 1 | $118B |
|
||
| Food / Beverage | 1 | $7B |
|
||
Price history
+289.4% since first listed7 events — show timeline
- 2026-05-26 Listed $249,000 NKMLS
- 2012-05-01 Listing Removed — NKMLS
- 2011-05-03 Listed $140,000 NKMLS
- 2011-03-31 Listing Removed — NKMLS
- 2010-02-24 Listed $150,000 NKMLS
- 1996-12-06 Sold (Public Records) $63,950 Public Records
- 1996-09-18 Sold (Public Records) $63,950 Public Records
Property tax history
+12.4%/yrLatest (2025): $1,667 · -4.7% YoY. Source: county tax records.
Cash-flow waterfall
monthlySold comps — $/sqft
last 12 mo · ≤1 miLoading sold comps…