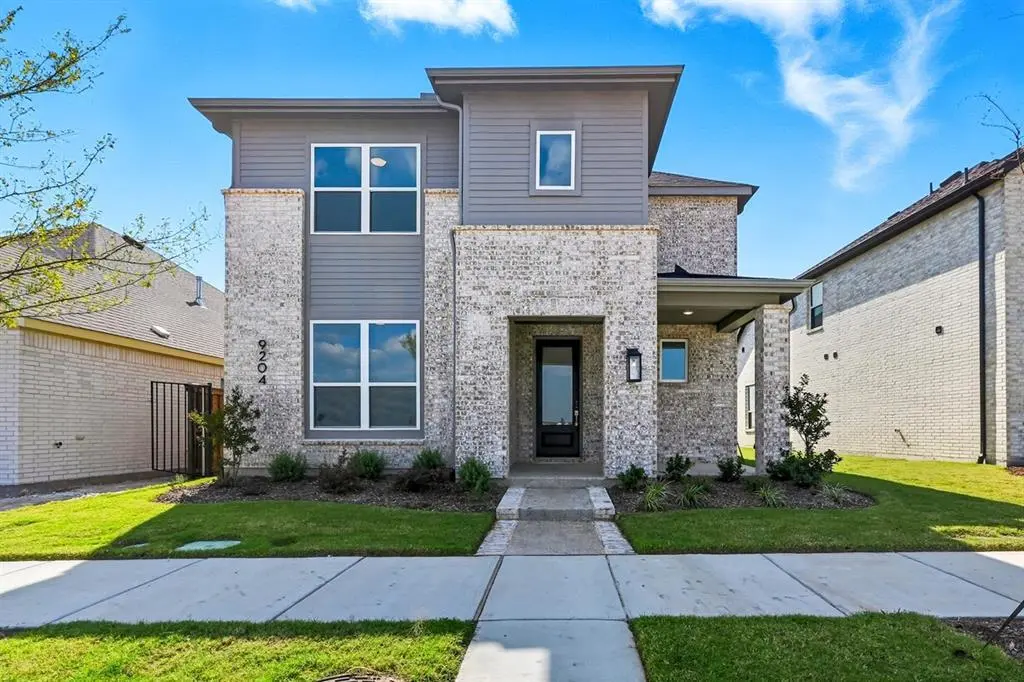
9204 Persimmon Ln
Mesquite, TX 75126
$369,954D-
5 bd · 3.0 ba ·
2,296 sqft ·
Built 2025
· Land
· Active
· 425 DOM
Cashflow @ list (25.0% down · 7.5%)
Estimated rent
$2,621/mo
Mortgage (P&I)
−$1,940
Tax + insurance
−$332
HOA
−$143
Vac / Maint / Mgmt
−$550
Net cashflow
$-345/mo
Annual
$-4,142/yr
Cap rate
5.17%
Cash-on-cash
-4.00%
DSCR
0.82
1% rule
0.71%
Cash to close
$103,587
Investor read
- This is a 5-bed/3.0-bath land listed at $370k.
- At list price, monthly cash flow is $-345 ($-4k/yr) — negative.
- To cash-flow at today's rent, offer at most $309k (16.5% below list).
- To meet the 1% rule (rent ≥ 1% of price), the offer needs to be $262k (29.2% below list).
- It's been on market 425 days — a 12% lower offer ($326k) is reasonable based on typical stale-listing flexibility.
- Recommended offer: $262k (29.2% below list) — sets the bar for 1% rule.
- Local home prices are declining (-3.0%/yr); year-one equity from $3k of loan paydown is wiped out by about $11k of value loss. Plan a longer hold.
- Location reads 70/100 on livability (#358 in TX) — a middle-class / working-renter tenant base. Strengths: cost of living A+, housing A+, health & safety A-; Watch: crime F, commute F.
- Forney ISD (rural): math 41% / reading 44% proficiency, ranked #234 of 826 in TX (top 28%) — families likely to look elsewhere, expect single-tenant / working-renter base with shorter leases.
- Zoned schools: Johnson El (math 57% / reading 50%, grade C, #686 of 4,322 statewide, top 16%, 694 students, 36% FRL); Warren Middle (math 43% / reading 50%, grade D+, #443 of 1,662 statewide, top 28%, 903 students, 26% FRL); Forney H S (math 64% / reading 58%, grade C+, #258 of 1,632 statewide, top 16%, 2,272 students, 28% FRL) — zoned schools at 30% FRL track the district average.
- Market conditions: Rents rising (+1.4%/yr); 2200 active listings in the ZIP; 1 comparable units currently listed for rent nearby; solid renter incomes; 1,747 units permitted in Kaufman County in 2024 (180 in 5+ unit buildings).
- Kaufman County population projected at +43% by 2050 — long-run rental-demand tailwind backs the buy-and-hold thesis.
- 3 sale attempts since 2y ago; this cycle's ask has dropped $36k (9%) from the opening price — seller is motivated, your offer sets the floor, not the list.
- This rent runs 30% of the median local income ($104k/yr) — at the standard rent-burdened threshold; future hikes will face affordability resistance.
Questions for listing agent
- What do current leases actually rent for vs. the listed asking? Can we see a recent rent roll and the last 12 months of T-12 income?
- It's been on market 425 days. Have you received any prior offers? Is the seller open to a 29% concession, seller financing, or rate buy-down credit?
- What does the HOA fee cover, when was the last increase, and are there any pending special assessments or reserve-fund shortfalls?
- Why hasn't it sold? Are there any deal-killer items the seller is aware of (foundation, flood, title, zoning, code violations)?
- Is there a deadline driving the sale (1031 exchange, divorce, estate, relocation)? That informs how much negotiation room exists.
- Crime grade is F in this area — have there been break-ins, vandalism, or insurance claims at this property in the last 3 years? What carrier currently insures it and at what premium?
- The area grade is low — what's the realistic commute time and amenity access for the typical tenant pool here? Any planned neighborhood developments (good or bad) we should know about?
- What's the average days-on-market for RENTAL listings here right now (not sales)? A rising rental-DOM trend means longer vacancies and softer asking-rent achievability than the comps imply.
CashFlowRE · CFR-50BEFA4PMDKY5D
· Data 1 day ago
cashflowre.app · 2026-05-29