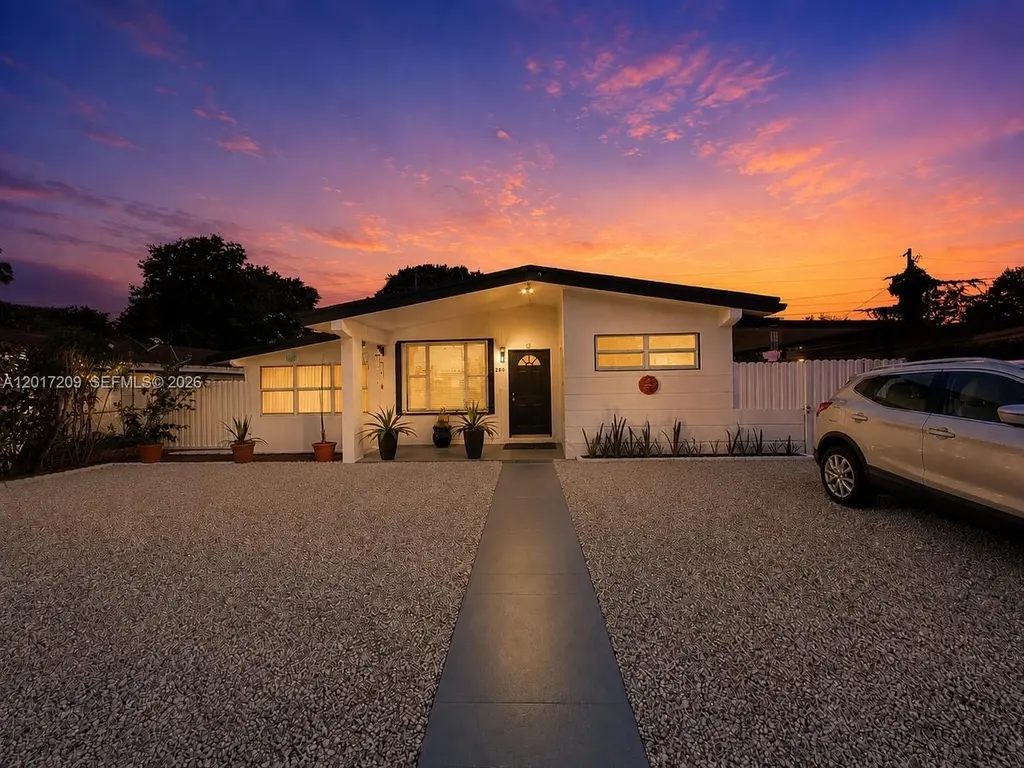
280 NE 173rd St
North Miami Beach, FL 33162
$475,000D-
2 bd · 1.0 ba ·
1,027 sqft ·
Built 1954
· SingleFamily
· Pending
· 15 DOM
Cashflow @ list (25.0% down · 7.5%)
Estimated rent
$3,245/mo
Mortgage (P&I)
−$2,491
Tax + insurance
−$278
HOA
−$0
Vac / Maint / Mgmt
−$682
Net cashflow
$-205/mo
Annual
$-2,462/yr
Cap rate
5.77%
Cash-on-cash
-1.85%
DSCR
0.92
1% rule
0.68%
Cash to close
$133,000
Investor read
- This is a 2-bed/1.0-bath single-family listed at $475k.
- At list price, monthly cash flow is $-205 ($-2k/yr) — negative.
- To cash-flow at today's rent, offer at most $439k (7.6% below list).
- To meet the 1% rule (rent ≥ 1% of price), the offer needs to be $325k (31.7% below list).
- It's been on market 15 days — a 2% lower offer ($468k) is reasonable based on typical stale-listing flexibility.
- Recommended offer: $325k (31.7% below list) — sets the bar for 1% rule.
- Local home prices are declining (-3.0%/yr); year-one equity from $3k of loan paydown is wiped out by about $14k of value loss. Plan a longer hold.
- Location reads 82/100 on livability (#71 in FL, #1,177 nationally) — a professional / high-income tenant draw. Strengths: commute A+, housing A+, health & safety A+; Watch: employment D+, crime F.
- Miami-Dade (suburban): math 45% / reading 54% proficiency, ranked #40 of 73 in FL (top 55%) — families likely to look elsewhere, expect single-tenant / working-renter base with shorter leases; 64% free/reduced lunch — lower-income household profile, screen leases tightly.
- Zoned schools: Gertrude K. Edelman/Sabal Palm (math 28% / reading 38%, grade F, #1,773 of 2,144 statewide, top 83%, 504 students, 76% FRL); Andover Middle School (math 16% / reading 33%, grade F, #522 of 571 statewide, top 93%, 452 students, 71% FRL); North Miami Beach Senior High (math 13% / reading 24%, grade F, #568 of 667 statewide, top 85%, 1,149 students, 66% FRL).
- Zoned-school proficiency averages 25% at this address vs 50% district-wide (-24 pts) — the specific schools serving this property underperform the Miami-Dade average; the district grade overstates school quality for this exact location.
- Watch-outs: built in 1954 — expect roof / HVAC / electrical / plumbing capex.
- Market conditions: Rents soft (-1.6%/yr); 287 active listings in the ZIP; 10,051 units permitted in Miami-Dade County in 2024 (7,758 in 5+ unit buildings).
- Miami-Dade County population projected at +28% by 2050 — long-run rental-demand tailwind backs the buy-and-hold thesis.
- Current owner paid $65k; list at $475k implies a 631% gain — meaningful room to come down on a strong offer.
- Climate carrying-cost: severe wind risk, 99% chance of damaging wind over 30y; extreme-heat days projected 6→20/yr by 2055 (HVAC capex compounding) — expect insurance premiums to compound above CPI over the hold.
- At $3,245/mo this rent would consume 64% of the median local household income ($61k/yr) (locally 2509% of renters already pay >50% of income on rent) — very limited rent-growth headroom before tenants either downsize or default.
Questions for listing agent
- What do current leases actually rent for vs. the listed asking? Can we see a recent rent roll and the last 12 months of T-12 income?
- Built in 1954 — when were the roof, HVAC, electrical panel, plumbing, and water heater last replaced?
- Is there a deadline driving the sale (1031 exchange, divorce, estate, relocation)? That informs how much negotiation room exists.
- Crime grade is F in this area — have there been break-ins, vandalism, or insurance claims at this property in the last 3 years? What carrier currently insures it and at what premium?
- The area grade is low — what's the realistic commute time and amenity access for the typical tenant pool here? Any planned neighborhood developments (good or bad) we should know about?
- What's the average days-on-market for RENTAL listings here right now (not sales)? A rising rental-DOM trend means longer vacancies and softer asking-rent achievability than the comps imply.
- What's the recent tenant-quality profile in this submarket — average credit score on applications, eviction rate, late-payment / NSF rate, and stable-employment percentage? A property-management company in the area should have these aggregated.
- How much new for-sale + rental construction is in the pipeline within 1–3 miles? Heavy new supply typically softens prices + rents 12–24 months out; constrained supply supports both.
CashFlowRE · CFR-50FH6T90900V9D
· Data 3 weeks ago
cashflowre.app · 2026-05-29