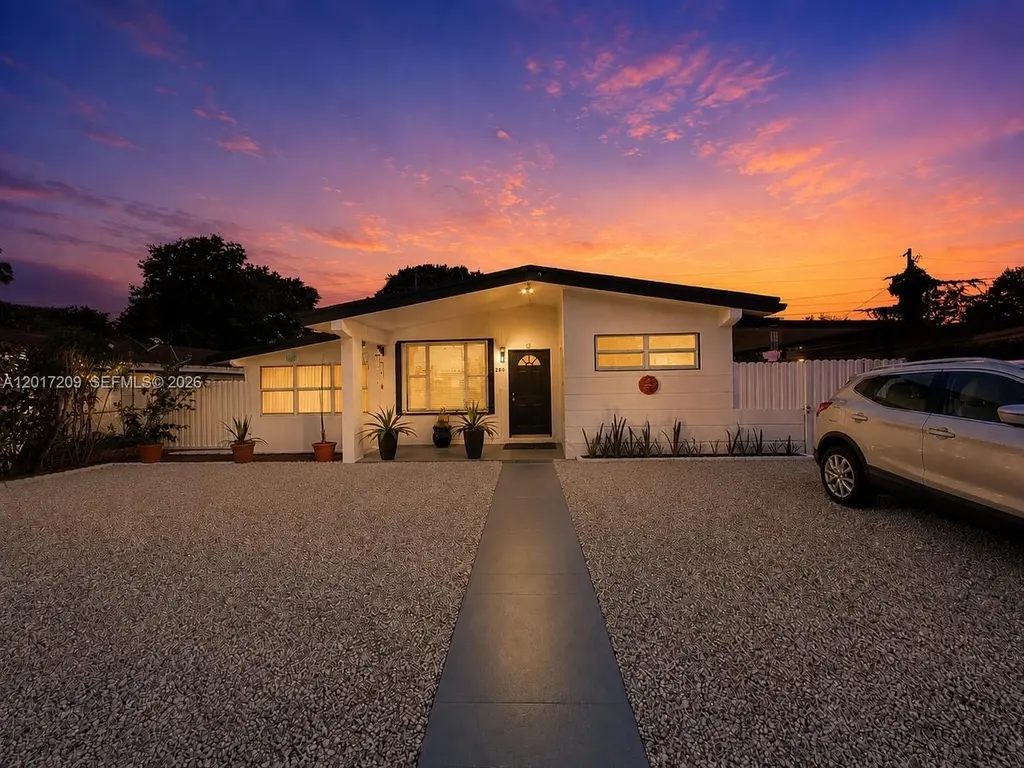
280 NE 173rd St · North Miami Beach, FL
Flood risk 4/10 · Minor
- FEMA flood zone
- X (unshaded)
- Chance of flooding over 30 yrs
- 0.13%
- Est. flood insurance / yr
- $507 – $1,088
Fire risk 1/10 · Minimal
- Est. fire insurance / yr
- $947 – $1,759
Heat risk 10/10 · Severe
- Hot days now (above 104°F)
- 6 days/yr
- Hot days in 30 yrs
- 20 days/yr
Wind risk 10/10 · Severe
- Chance of severe wind over 30 yrs
- 99.0%
Air-quality risk 2/10 · Minimal
- Unhealthy air days now
- 1 days/yr
- Unhealthy air days in 30 yrs
- 2 days/yr
Risk factors via First Street. Map © Google.
Why this score? — see what drove the D- grade
The composite is a weighted blend of 9 inputs, each scored 0–100. Each bar is that input's sub-score; the figure is the points it added to the 100-point composite (weight × sub-score).
- Cash flow +10.9/30.0
- ARV discount +7.5/15.0
- Schools +4.2/10.0
- Livability +4.1/5.0
- DSCR +3.2/10.0
- Condition / age +2.5/5.0
- Rent growth +2.1/5.0
- 1% rule +1.8/10.0
- Appreciation +0.0/10.0
$475,000
🖨 Deal sheet (PDF) 📄 Offer letter ✓ Due diligence
Listing remarks
Beautiful move-in ready home in North Miami Beach featuring an open floor plan and excellent overall condition. This well maintained property offers a renovated kitchen, one updated bathroom, new roof, new A/C system, separate laundry room, new whole-house water filtration system, and hurricane shutters on most windows. Spacious layout with great natural light and functional living areas. Excellent opportunity for owner occupants or investors, with potential to create an income producing unit within the property. Conveniently located near major highways, shopping, dining, and schools. A true turnkey property with major upgrades already completed.
Key facts
- Open floor plan
- New a/c system
- Renovated kitchen
Tags
Property features AI
Exterior
- Parking: Driveway
- Security: Storm/security shutters
- Utilities: Public water; Septic tank
- Home design: Faces north
- Construction: Block construction; Shingle roof; Effective year built
- Exterior features: Deck; Open deck; Porch; Fence; Shed; Storm/security shutters
Interior
- Kitchen: Microwave; Refrigerator
- Bedrooms: Bedroom on main level
- Flooring: Tile flooring
- Bathrooms: 2 full bathrooms
- Heating & cooling: Central heating; Central electric cooling (central air)
- Interior features: First-floor entry; Main-level bedroom
- Laundry & utility: Washer; Dryer; Water softener (owned); Utility room; Laundry room
Neighborhood map
What this means for you Summary
Snapshot
- This is a 2-bed/1.0-bath single-family listed at $475k.
Deal economics
- At list price, monthly cash flow is $-205 ($-2k/yr) — negative.
- To cash-flow at today's rent, offer at most $439k (7.6% below list).
- To meet the 1% rule (rent ≥ 1% of price), the offer needs to be $325k (31.7% below list).
- Recommended offer: $325k (31.7% below list) — sets the bar for 1% rule.
Location & tenants
- Location reads 82/100 on livability (#71 in FL, #1,177 nationally) — a professional / high-income tenant draw. Strengths: commute A+, housing A+, health & safety A+; Watch: employment D+, crime F.
- Miami-Dade (suburban): math 45% / reading 54% proficiency, ranked #40 of 73 in FL (top 55%) — families likely to look elsewhere, expect single-tenant / working-renter base with shorter leases; 64% free/reduced lunch — lower-income household profile, screen leases tightly.
- Zoned schools: Gertrude K. Edelman/Sabal Palm (math 28% / reading 38%, grade F, #1,773 of 2,144 statewide, top 83%, 504 students, 76% FRL); Andover Middle School (math 16% / reading 33%, grade F, #522 of 571 statewide, top 93%, 452 students, 71% FRL); North Miami Beach Senior High (math 13% / reading 24%, grade F, #568 of 667 statewide, top 85%, 1,149 students, 66% FRL).
- Zoned-school proficiency averages 25% at this address vs 50% district-wide (-24 pts) — the specific schools serving this property underperform the Miami-Dade average; the district grade overstates school quality for this exact location.
- Market conditions: Rents soft (-1.6%/yr); 287 active listings in the ZIP; 10,051 units permitted in Miami-Dade County in 2024 (7,758 in 5+ unit buildings).
- At $3,245/mo this rent would consume 64% of the median local household income ($61k/yr) (locally 2509% of renters already pay >50% of income on rent) — very limited rent-growth headroom before tenants either downsize or default.
Forward outlook
- Local home prices are declining (-3.0%/yr); year-one equity from $3k of loan paydown is wiped out by about $14k of value loss. Plan a longer hold.
- Miami-Dade County population projected at +28% by 2050 — long-run rental-demand tailwind backs the buy-and-hold thesis.
Negotiation context
- It's been on market 15 days — a 2% lower offer ($468k) is reasonable based on typical stale-listing flexibility.
- Current owner paid $65k; list at $475k implies a 631% gain — meaningful room to come down on a strong offer.
Risks & watch-outs
- Watch-outs: built in 1954 — expect roof / HVAC / electrical / plumbing capex.
- Climate carrying-cost: severe wind risk, 99% chance of damaging wind over 30y; extreme-heat days projected 6→20/yr by 2055 (HVAC capex compounding) — expect insurance premiums to compound above CPI over the hold.
Questions for the listing agent
- What do current leases actually rent for vs. the listed asking? Can we see a recent rent roll and the last 12 months of T-12 income?
- Built in 1954 — when were the roof, HVAC, electrical panel, plumbing, and water heater last replaced?
- Is there a deadline driving the sale (1031 exchange, divorce, estate, relocation)? That informs how much negotiation room exists.
- Crime grade is F in this area — have there been break-ins, vandalism, or insurance claims at this property in the last 3 years? What carrier currently insures it and at what premium?
- The area grade is low — what's the realistic commute time and amenity access for the typical tenant pool here? Any planned neighborhood developments (good or bad) we should know about?
- What's the average days-on-market for RENTAL listings here right now (not sales)? A rising rental-DOM trend means longer vacancies and softer asking-rent achievability than the comps imply.
- What's the recent tenant-quality profile in this submarket — average credit score on applications, eviction rate, late-payment / NSF rate, and stable-employment percentage? A property-management company in the area should have these aggregated.
- How much new for-sale + rental construction is in the pipeline within 1–3 miles? Heavy new supply typically softens prices + rents 12–24 months out; constrained supply supports both.
Investment metrics
- 1% rule
- 0.68% ✗
- Cap rate
- 5.77%
- Cash-on-cash
- -1.85%
- DSCR
- 0.92
- GRM
- 12.2
CMA / ARV
- ARV (on-the-fly)
- $474,474
- Comps found
- 1
Show comp detail 1 sale within ~0.75 mi
| Address | Dist | Beds/Ba | Sqft | Sold | Price | $/sf | Match |
|---|---|---|---|---|---|---|---|
| 591 NE 170th St | 0.41mi | 3/2.0 (+1) | 1,103 (+7%) | 17mo | $510,000 | $462 | 45 |
Match score weights: distance 35% · size 25% · config 20% · recency 20%. Top-matched comps best support the ARV.
Projected returns pro-forma
-3.0% appreciation · 0.0% rent growth · sell at horizon
- IRR
- -22.3%
- Equity multiple
- 0.25×
- Total profit
- $-99,815
- Equity at exit
- $70,824
- IRR
- -24.3%
- Equity multiple
- -0.06×
- Total profit
- $-141,582
- Equity at exit
- $41,069
Cash invested: $133,000 (down + closing). Projections, not guarantees.
Landlord ↔ Tenant lean methodology
- Overall (STATE)
- 87 Strongly Landlord-Friendly
- State Florida
- 87 Strongly Landlord-Friendly · R+3
- County
- — inherits STATE
- City
- — inherits STATE
ZIP-level market 33162
- Rents YoY
- -1.6%
- Active inventory
- 287
- Price-to-rent
- 12.2×
Monthly cashflow live
- Estimated rent
- $3,245 medium interval (Pro) →
- Mortgage (P&I)
- −$2,491
- Tax from tax record
- −$80 /mo · $962/yr
- Insurance
- −$198
- HOA
- −$0
- Vacancy / Maint / Mgmt
- −$682
- Net cashflow
- $-205
Break-even live
Sensitivity live
| Price | -10% $64 | -5% $-71 | +0% $-205 | +5% $-883 | +10% $-1,047 |
|---|---|---|---|---|---|
| Rent | -10% $-462 | -5% $-333 | +0% $-205 | +5% $-77 | +10% $51 |
| Rate | -1.0pp $34 | -0.5pp $-84 | base $-205 | +0.5pp $-328 | +1.0pp $-453 |
UW: 25.0% down · 7.5% · 30yr · 1.5% tax · 5.0% vac · 8.0% maint · 8.0% mgmt
Financing live
Cash to close
- Down payment
- $118,750
- Closing costs
- $14,250
- Reserves months
- —
- Total cash needed
- —
Loan-product check · same deal, 3 products live
Conventional
25% down · 7.5% · 30yr
- Down + closing
- —
- Monthly P&I
- —
- Monthly cashflow
- —
- DSCR
- —
- Eligible?
- —
Personal DTI + credit; lowest rate.
DSCR
20% down · 8.5% · 30yr
- Down + closing
- —
- Monthly P&I
- —
- Monthly cashflow
- —
- DSCR
- —
- Eligible?
- —
No personal income docs; deal must DSCR.
Hard money
10% down · 12.0% · 12mo
- Down + closing
- —
- Monthly P&I
- —
- Monthly cashflow
- —
- DSCR
- —
- Eligible?
- —
Short-term bridge; refi at stabilization.
Listing history 3 events
-
2026-05-11$475,000 Active
-
1993-12-01soldstatus $65,000
-
1987-05-01soldstatus $57,500
ⓘ Source: listings_history table (triggers on properties + properties_extension) + one-shot
backfill from property_details.listing_events for pre-trigger history.
Tax reassessment forecast FL · Resets to sale price
- Current annual tax
- $962 · $80/mo
- Projected year-2 tax
- $3,942 · $329/mo
- Expected delta
- +$2,981/yr (+$248/mo · 309.9%)
ⓘ Screening estimate from a state-policy table — verify with the county assessor before closing.
Climate risk First Street
- Flood 4/10 Moderate FEMA zone X (unshaded) · 13% chance over 30 yrs
- Wildfire 1/10 Low
- Heat 10/10 Extreme 6 d/yr ≥104°F today · 20 d/yr by 30 yrs out
- Wind 10/10 Extreme 99% chance of damaging wind over 30 yrs
- Air quality 2/10 Low 1 unhealthy d/yr today · 2 by 30 yrs out
Nearby sold comps map
Loading sold comps map…
Walkable amenities ~0.75 mi
Loading nearby amenities…
Taxation est. · year 1
- Rental income
- $38,945
- − Mortgage interest
- −$26,607
- − Property taxes
- −$962
- − Insurance
- −$2,375
- − Repairs & maintenance
- −$3,116
- − Management
- −$3,116
- − Depreciation
- −$13,818
- Taxable loss
- −$11,049
- Est. tax savings @ 24.0%
- +$2,652
- After-tax cash flow
- $190/yr
For passive investors: Depreciation is non-cash, so a rental often shows a tax loss while cash-flowing — sheltering income. Rental losses are passive: they offset passive income freely, and up to $25,000/yr can offset ordinary (W-2) income if you actively participate and your MAGI is under $100k (phasing out to $0 by $150k); unused losses carry forward. On sale, claimed depreciation is recaptured at up to 25%, and gains may owe capital-gains tax (a 1031 exchange can defer both). Figures are a year-1 estimate at your 24.0% rate — not tax advice; consult a CPA.
Schools (NCES district)
- District
- Miami-Dade
- NCES district ID
- 1200390
- Math proficiency
- 45% ▼ -16.00%
- Reading proficiency
- 54% ▼ -5.00%
- Median HH income
- $43,928
- Composite
- 41.76/100
- National rank
- #3397
- State rank
- #40 of 73 in FL
Livability — North Miami Beach
- Score
- 82/100
- State rank
- #71
- US rank
- #1177
Category grades
Schools grade is shown separately in the Schools card above.
Census & demographics
- Census place
- North Miami Beach, FL
- County
- Miami-Dade County · 2,697,751 people
- Metro
- Miami-Fort Lauderdale-Pompano Beach, FL
- Population (ZIP)
- 46,606
- Household income
- $60,692
- Rent vs Own
- Severe rent burden
- 2509.0
Population outlook (Miami-Dade County) Hauer SSP2
- Today (2025)
- 3,126,439 people
- By 2030
- 3,325,765 · +6.4%
- By 2040
- 3,697,561 · +18.3%
- By 2050
- 4,012,134 · +28.3%
- By 2075
- 4,605,612 · +47.3%
- By 2100
- 4,866,598 · +55.7%
Race, ethnicity, and origin ACS 2023
- Neighborhood character
- Diverse neighborhood (Simpson 0.62)
- Race & ethnicity
- Black 53% Hispanic / Latino 30% Two or more races 15% White 12% Asian 2%
- Hispanic origin (detail)
- Puerto Rican 4% Cuban 7% Dominican 3%
- Common ancestry
- Hispanic 31% Romanian 1% Scotch-Irish 1%
- Foreign-born
- 52% · Canada, Jamaica, Dominican Republic
- Languages at home
- 29% English-only · French/Haitian/Cajun 35% Spanish 30% Other Indo-European 2%
Political lean MEDSL · Miami-Dade
- 2024 margin
- R (+11.4) · D 43.9% · R 55.4%
- 2008→2024 swing
- -27.6pp toward R · 2008: 16.1pp · 2024: -11.4pp
- All cycles
- 2024: R+11.4 2020: D+7.3 2016: D+29.6 2012: D+23.7 2008: D+16.1
Not yet ingested
- Civics
- —
Market trends
- HPI YoY
- ▼ -445.57%
- Current HPI
- 596.6178
- Rent YoY
- ▼ -1.59%
- Metro
- Miami-Fort Lauderdale-Pompano Beach, FL
- State GDP YoY
- ▲ 3.28%
- F500 in state
- 36
Industry mix (Fortune 500 HQ in FL)
| Industry | F500 HQs | Revenue |
|---|---|---|
| Industrial Technology | 2 | $29B |
|
||
| Insurance | 2 | $17B |
|
||
| Retail | 1 | $60B |
|
||
| Technology Distribution | 1 | $58B |
|
||
| Homebuilding | 1 | $35B |
|
||
| Technology Manufacturing | 1 | $35B |
|
||
Price history
+726.1% since first listed3 events — show timeline
- 2026-05-11 Listed $475,000 MARMLS
- 1993-12-01 Sold (Public Records) $65,000 Public Records
- 1987-05-01 Sold (Public Records) $57,500 Public Records
Property tax history
+1.7%/yrLatest (2025): $962 · +0.2% YoY. Source: county tax records.
Cash-flow waterfall
monthlySold comps — $/sqft
last 12 mo · ≤1 miLoading sold comps…