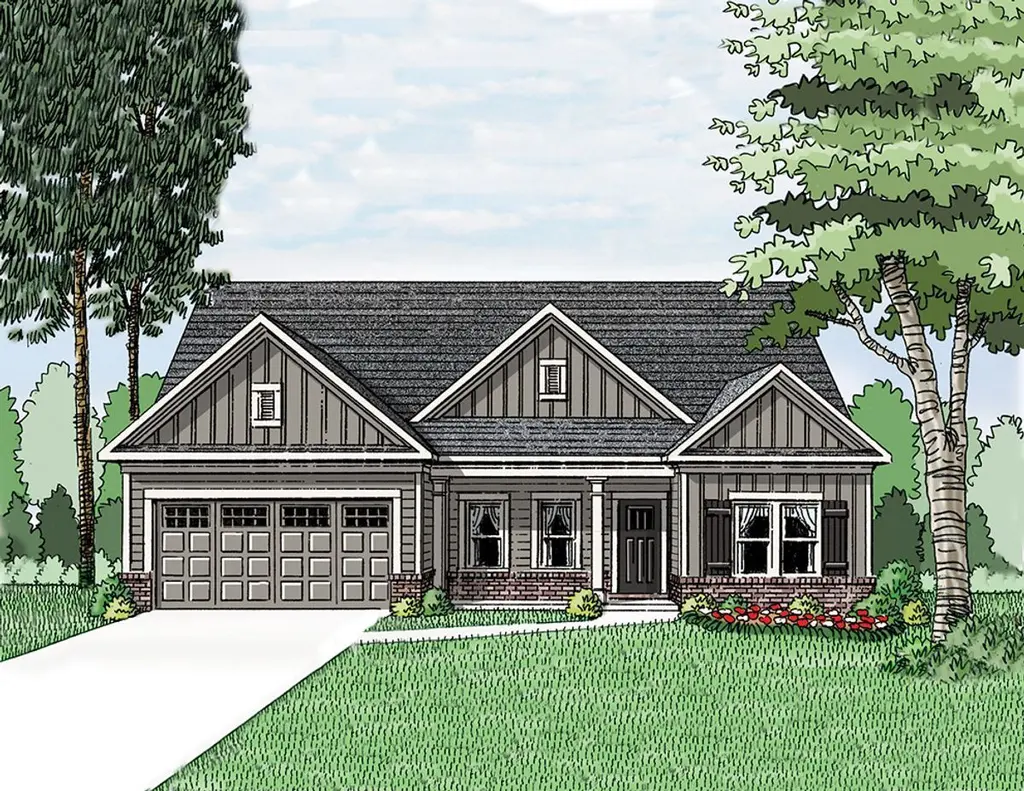
(GA)The Everett | Front Entry Plan
Eatonton, GA 31024
$333,000F
4 bd · 3.0 ba ·
2,188 sqft ·
Built —
· SingleFamily
· Active
· 28 DOM
Cashflow @ list (25.0% down · 7.5%)
Estimated rent
$3,407/mo
Mortgage (P&I)
−$4,727
Tax + insurance
−$1,502
HOA
−$0
Vac / Maint / Mgmt
−$715
Net cashflow
$-3,538/mo
Annual
$-42,459/yr
Cap rate
1.58%
Cash-on-cash
-16.82%
DSCR
0.25
1% rule
0.38%
Cash to close
$252,408
Investor read
- This is a 4-bed/3.0-bath single-family listed at $333k. Condition is rated good.
- At list price, monthly cash flow is $-4k ($-42k/yr) — negative.
- The deal already cash-flows at list — no discount required.
- Meets the 1% rule at list price ($3k rent vs $333k).
- It's been on market 28 days — a 2% lower offer ($328k) is reasonable based on typical stale-listing flexibility.
- Recommended offer: $328k (1.5% below list) — sets the bar for market timing.
- Local home prices are declining (-3.0%/yr); year-one equity from $6k of loan paydown is wiped out by about $27k of value loss. Plan a longer hold.
- Location reads 71/100 on livability (#76 in GA) — a middle-class / working-renter tenant base. Strengths: cost of living A+, housing A+, crime A; Watch: schools F, amenities F, commute F.
- Putnam County (rural): math 33% / reading 30% proficiency, ranked #86 of 174 in GA (top 49%) — families likely to look elsewhere, expect single-tenant / working-renter base with shorter leases; 69% free/reduced lunch — lower-income household profile, screen leases tightly.
- Watch-outs: property tax is 4.1% of price.
- Market conditions: 522 active listings in the ZIP; 2 comparable units currently listed for rent nearby; 129 units permitted in Putnam County in 2024 (50 in 5+ unit buildings).
- Putnam County population projected at -18% by 2050 — secular population decline; favor cash flow + early exit over multi-decade hold.
- Cap rate 1.6% vs local median 4.2% in Eatonton — below-typical yield; the buyer is paying a premium for something (appreciation thesis, condition, location) that the cap rate doesn't capture.
- At $3,407/mo this rent would consume 62% of the median local household income ($66k/yr) (locally 696% of renters already pay >50% of income on rent) — very limited rent-growth headroom before tenants either downsize or default.
Questions for listing agent
- What do current leases actually rent for vs. the listed asking? Can we see a recent rent roll and the last 12 months of T-12 income?
- Property tax is high relative to price — has the assessment been appealed recently, and will the sale trigger a re-assessment?
- Is there a deadline driving the sale (1031 exchange, divorce, estate, relocation)? That informs how much negotiation room exists.
- Schools are F-rated, which usually means shorter tenancies and higher turnover. Who's the typical renter profile here, and what's been the actual vacancy rate?
- The area grade is low — what's the realistic commute time and amenity access for the typical tenant pool here? Any planned neighborhood developments (good or bad) we should know about?
- What's the average days-on-market for RENTAL listings here right now (not sales)? A rising rental-DOM trend means longer vacancies and softer asking-rent achievability than the comps imply.
- What's the recent tenant-quality profile in this submarket — average credit score on applications, eviction rate, late-payment / NSF rate, and stable-employment percentage? A property-management company in the area should have these aggregated.
- How much new for-sale + rental construction is in the pipeline within 1–3 miles? Heavy new supply typically softens prices + rents 12–24 months out; constrained supply supports both.
CashFlowRE · CFR-512G366DK7DFK1
· Data 1 day ago
cashflowre.app · 2026-05-29