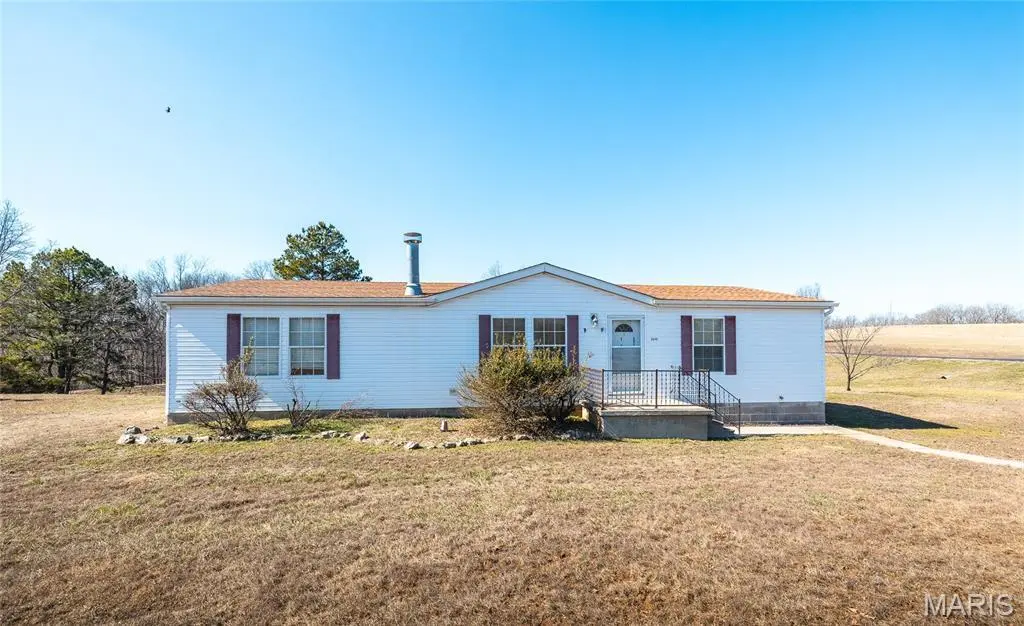
22299 Lansing Dr
Marble Hill, MO 63764
$151,000F
3 bd · 2.0 ba ·
1,740 sqft ·
Built 2004
· Manufactured
· Active
· 23 DOM
Cashflow @ list (25.0% down · 7.5%)
Estimated rent
$957/mo
Mortgage (P&I)
−$792
Tax + insurance
−$252
HOA
−$0
Vac / Maint / Mgmt
−$201
Net cashflow
$-288/mo
Annual
$-3,451/yr
Cap rate
4.01%
Cash-on-cash
-8.16%
DSCR
0.64
1% rule
0.63%
Cash to close
$42,280
Investor read
- This is a 3-bed/2.0-bath manufactured listed at $151k. Condition is rated fair.
- At list price, monthly cash flow is $-288 ($-3k/yr) — negative.
- To cash-flow at today's rent, offer at most $109k (27.6% below list).
- To meet the 1% rule (rent ≥ 1% of price), the offer needs to be $96k (36.6% below list).
- It's been on market 23 days — a 2% lower offer ($149k) is reasonable based on typical stale-listing flexibility.
- Recommended offer: $96k (36.6% below list) — sets the bar for 1% rule.
- In year one you build about $6k of equity ($1k loan paydown + $5k appreciation (3.0% local appreciation)).
- Location reads 60/100 on livability (#508 in MO) — a middle-class / working-renter tenant base. Strengths: cost of living A+, crime A, housing A-; Watch: amenities F, commute F, employment F.
- Woodland R-IV (rural): math 27% / reading 42% proficiency, ranked #239 of 324 in MO (top 74%) — families likely to look elsewhere, expect single-tenant / working-renter base with shorter leases.
- Zoned schools: Woodland Elem. (math 32% / reading 32%, grade F, #761 of 1,115 statewide, top 72%, 347 students, 63% FRL); Woodland Middle (math 30% / reading 47%, grade F, #202 of 391 statewide, top 54%, 261 students, 56% FRL); Woodland High (math 12% / reading 37%, grade F, #445 of 521 statewide, top 87%, 248 students, 51% FRL) — zoned schools at 57% FRL track the district average.
- Market conditions: 44 active listings in the ZIP.
- Bollinger County population projected at -14% by 2050 — secular population decline; favor cash flow + early exit over multi-decade hold.
- By year 7, paydown + projected appreciation supports a ~$35k cash-out refi (75% LTV) — recoverable capital for the next deal without selling this one.
- Cap rate 4.0% vs local median 5.1% in Marble Hill — below-typical yield; the buyer is paying a premium for something (appreciation thesis, condition, location) that the cap rate doesn't capture.
Questions for listing agent
- What do current leases actually rent for vs. the listed asking? Can we see a recent rent roll and the last 12 months of T-12 income?
- Have any recent inspections been done? Can we get a copy of the seller's disclosures and any deferred-maintenance estimates?
- Is there a deadline driving the sale (1031 exchange, divorce, estate, relocation)? That informs how much negotiation room exists.
- Schools are F-rated, which usually means shorter tenancies and higher turnover. Who's the typical renter profile here, and what's been the actual vacancy rate?
- The area grade is low — what's the realistic commute time and amenity access for the typical tenant pool here? Any planned neighborhood developments (good or bad) we should know about?
- What's the average days-on-market for RENTAL listings here right now (not sales)? A rising rental-DOM trend means longer vacancies and softer asking-rent achievability than the comps imply.
- What's the recent tenant-quality profile in this submarket — average credit score on applications, eviction rate, late-payment / NSF rate, and stable-employment percentage? A property-management company in the area should have these aggregated.
- How much new for-sale + rental construction is in the pipeline within 1–3 miles? Heavy new supply typically softens prices + rents 12–24 months out; constrained supply supports both.
Repairs flagged (vision-AI assessment)
- Major: Paint — Paint is chipping and faded in multiple areas.
- Major: Flooring — Carpeted floors in living areas appear worn.
- Moderate: Exterior Siding — Siding appears weathered.
CashFlowRE · CFR-52XGMX69EKZ557
· Data 13 h ago
cashflowre.app · 2026-05-29