22299 Lansing Dr · Marble Hill, MO
Flood risk 1/10 · Minimal
- FEMA flood zone
- —
- Chance of flooding over 30 yrs
- 0.0%
- Est. flood insurance / yr
- —
Fire risk 4/10 · Minor
- Est. fire insurance / yr
- $1,054 – $1,958
Heat risk 4/10 · Minor
- Hot days now (above 105°F)
- 7 days/yr
- Hot days in 30 yrs
- 21 days/yr
Wind risk 2/10 · Minimal
- Chance of severe wind over 30 yrs
- 3.0%
Air-quality risk 1/10 · Minimal
- Unhealthy air days now
- 0 days/yr
- Unhealthy air days in 30 yrs
- 0 days/yr
Risk factors via First Street. Map © Google.
Why this score? — see what drove the F grade
The composite is a weighted blend of 9 inputs, each scored 0–100. Each bar is that input's sub-score; the figure is the points it added to the 100-point composite (weight × sub-score).
- ARV discount +7.5/15.0
- Cash flow +6.0/30.0
- Appreciation +5.0/10.0
- Livability +3.0/5.0
- Schools +2.8/10.0
- Rent growth +2.5/5.0
- Condition / age +2.2/5.0
- 1% rule +1.3/10.0
- DSCR +0.4/10.0
$151,000
🖨 Deal sheet (PDF) 📄 Offer letter ✓ Due diligence
Listing remarks
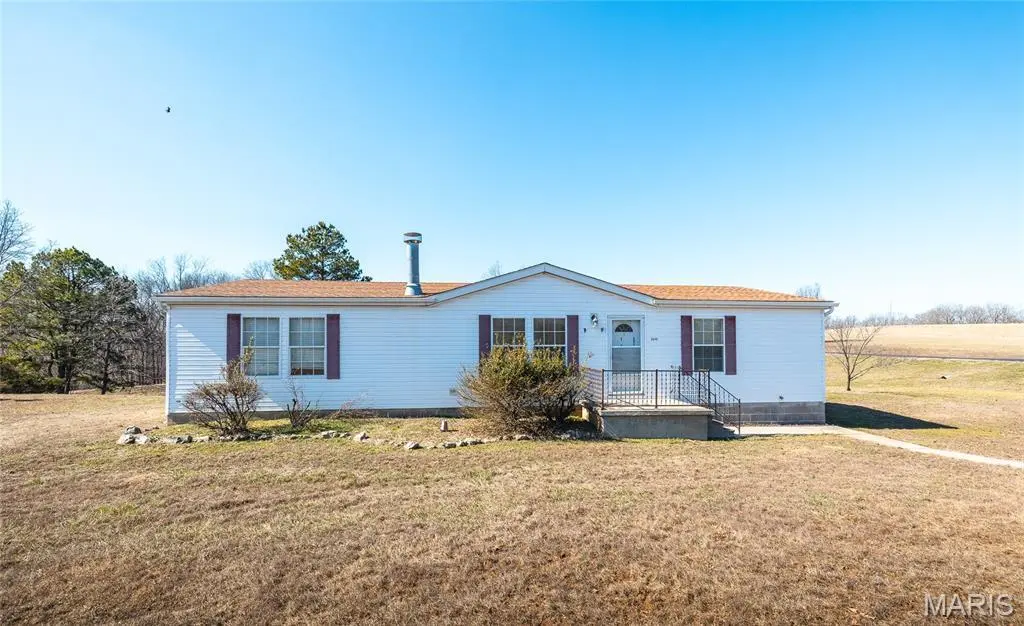
Enjoy affordable country living with this 3-bedroom, 2-bath manufactured home situated on 3 +/- scenic acres with access to a beautiful shared pond. Conveniently located just off State Highway 51, this property offers excellent access while still providing the peace of rural living. The spacious setting provides plenty of room to relax or enjoy outdoor activities, all while taking in the tranquil surroundings. Whether you’re looking for a comfortable full-time residence or a peaceful retreat, this property offers the perfect blend of convenience, space, and value.
Key facts
- Shared pond
- Spacious setting
- 3 acre lot
Tags
Property features AI
Exterior
- Parking: On-site parking; On-street parking
- Utilities: Shared well water; Shared septic; Single-phase electric
- Home design: Manufactured home; Single-story
- Construction: Vinyl siding; Architectural shingle roof; Block foundation; Manufactured house construction
- Exterior features: Pond on the lot; Paved roads with county road and highway frontage
Interior
- Bedrooms: Three bedrooms (all on the main level)
- Bathrooms: Two full bathrooms (on the main level)
- Heating & cooling: Electric heating; Central air conditioning
- Interior features: Crawl space basement; One fireplace
Neighborhood map
What this means for you Summary
Snapshot
- This is a 3-bed/2.0-bath manufactured listed at $151k. Condition is rated fair.
Deal economics
- At list price, monthly cash flow is $-288 ($-3k/yr) — negative.
- To cash-flow at today's rent, offer at most $109k (27.6% below list).
- To meet the 1% rule (rent ≥ 1% of price), the offer needs to be $96k (36.6% below list).
- Recommended offer: $96k (36.6% below list) — sets the bar for 1% rule.
- Cap rate 4.0% vs local median 5.1% in Marble Hill — below-typical yield; the buyer is paying a premium for something (appreciation thesis, condition, location) that the cap rate doesn't capture.
Location & tenants
- Location reads 60/100 on livability (#508 in MO) — a middle-class / working-renter tenant base. Strengths: cost of living A+, crime A, housing A-; Watch: amenities F, commute F, employment F.
- Woodland R-IV (rural): math 27% / reading 42% proficiency, ranked #239 of 324 in MO (top 74%) — families likely to look elsewhere, expect single-tenant / working-renter base with shorter leases.
- Zoned schools: Woodland Elem. (math 32% / reading 32%, grade F, #761 of 1,115 statewide, top 72%, 347 students, 63% FRL); Woodland Middle (math 30% / reading 47%, grade F, #202 of 391 statewide, top 54%, 261 students, 56% FRL); Woodland High (math 12% / reading 37%, grade F, #445 of 521 statewide, top 87%, 248 students, 51% FRL) — zoned schools at 57% FRL track the district average.
- Market conditions: 44 active listings in the ZIP.
Forward outlook
- In year one you build about $6k of equity ($1k loan paydown + $5k appreciation (3.0% local appreciation)).
- Bollinger County population projected at -14% by 2050 — secular population decline; favor cash flow + early exit over multi-decade hold.
- By year 7, paydown + projected appreciation supports a ~$35k cash-out refi (75% LTV) — recoverable capital for the next deal without selling this one.
Negotiation context
- It's been on market 23 days — a 2% lower offer ($149k) is reasonable based on typical stale-listing flexibility.
Questions for the listing agent
- What do current leases actually rent for vs. the listed asking? Can we see a recent rent roll and the last 12 months of T-12 income?
- Have any recent inspections been done? Can we get a copy of the seller's disclosures and any deferred-maintenance estimates?
- Is there a deadline driving the sale (1031 exchange, divorce, estate, relocation)? That informs how much negotiation room exists.
- Schools are F-rated, which usually means shorter tenancies and higher turnover. Who's the typical renter profile here, and what's been the actual vacancy rate?
- The area grade is low — what's the realistic commute time and amenity access for the typical tenant pool here? Any planned neighborhood developments (good or bad) we should know about?
- What's the average days-on-market for RENTAL listings here right now (not sales)? A rising rental-DOM trend means longer vacancies and softer asking-rent achievability than the comps imply.
- What's the recent tenant-quality profile in this submarket — average credit score on applications, eviction rate, late-payment / NSF rate, and stable-employment percentage? A property-management company in the area should have these aggregated.
- How much new for-sale + rental construction is in the pipeline within 1–3 miles? Heavy new supply typically softens prices + rents 12–24 months out; constrained supply supports both.
Investment metrics
- 1% rule
- 0.63% ✗
- Cap rate
- 4.01%
- Cash-on-cash
- -8.16%
- DSCR
- 0.64
- GRM
- 13.2
CMA / ARV
No comps found within radius.
Projected returns pro-forma
3.0% appreciation · 3.0% rent growth · sell at horizon
- IRR
- -0.0%
- Equity multiple
- 1.00×
- Total profit
- $-113
- Equity at exit
- $67,896
- IRR
- 3.9%
- Equity multiple
- 1.60×
- Total profit
- $25,312
- Equity at exit
- $104,636
Cash invested: $42,280 (down + closing). Projections, not guarantees.
Landlord ↔ Tenant lean methodology
- Overall (STATE)
- 81 Strongly Landlord-Friendly
- State Missouri
- 81 Strongly Landlord-Friendly · R+10
- County
- — inherits STATE
- City
- — inherits STATE
ZIP-level market 63764
- Active inventory
- 44
- Price-to-rent
- 13.2×
Monthly cashflow live
- Estimated rent
- $957 medium interval (Pro) →
- Mortgage (P&I)
- −$792
- Tax est. 1.5%
- −$189 /mo · $2,265/yr
- Insurance
- −$63
- HOA
- −$0
- Lot rent leased land?
- −$0
- Vacancy / Maint / Mgmt
- −$201
- Net cashflow
- $-288
Break-even live
Sensitivity live
| Price | -10% $-183 | -5% $-235 | +0% $-288 | +5% $-340 | +10% $-392 |
|---|---|---|---|---|---|
| Rent | -10% $-363 | -5% $-325 | +0% $-288 | +5% $-250 | +10% $-212 |
| Rate | -1.0pp $-212 | -0.5pp $-249 | base $-288 | +0.5pp $-327 | +1.0pp $-367 |
UW: 25.0% down · 7.5% · 30yr · 1.5% tax · 5.0% vac · 8.0% maint · 8.0% mgmt
Financing live
Cash to close
- Down payment
- $37,750
- Closing costs
- $4,530
- Reserves months
- —
- Total cash needed
- —
Loan-product check · same deal, 3 products live
Conventional
25% down · 7.5% · 30yr
- Down + closing
- —
- Monthly P&I
- —
- Monthly cashflow
- —
- DSCR
- —
- Eligible?
- —
Personal DTI + credit; lowest rate.
DSCR
20% down · 8.5% · 30yr
- Down + closing
- —
- Monthly P&I
- —
- Monthly cashflow
- —
- DSCR
- —
- Eligible?
- —
No personal income docs; deal must DSCR.
Hard money
10% down · 12.0% · 12mo
- Down + closing
- —
- Monthly P&I
- —
- Monthly cashflow
- —
- DSCR
- —
- Eligible?
- —
Short-term bridge; refi at stabilization.
Listing history 18 events
-
2026-06-22days on market $151,000 Active 23 DOM
-
2026-06-21days on market $151,000 Active 22 DOM
-
2026-06-21days on market $151,000 Active 21 DOM
-
2026-06-18days on market $151,000 Active 19 DOM
-
2026-06-17days on market $151,000 Active 18 DOM
-
2026-06-16days on market $151,000 Active 17 DOM
-
2026-06-15days on market $151,000 Active 16 DOM
-
2026-06-13days on market $151,000 Active 14 DOM
-
2026-06-12days on market $151,000 Active 13 DOM
-
2026-06-09days on market $151,000 Active 10 DOM
-
2026-06-08days on market $151,000 Active 9 DOM
-
2026-06-07days on market $151,000 Active 8 DOM
-
2026-06-07days on market $151,000 Active 7 DOM
-
2026-06-04days on market $151,000 Active 4 DOM
-
2026-06-02days on market $151,000 Active 3 DOM
-
2026-06-01days on market $151,000 Active 2 DOM
-
2026-05-31remarks 570-char remark
-
2026-05-31$151,000 Active 1 DOM
ⓘ Source: listings_history table (triggers on properties + properties_extension) + one-shot
backfill from property_details.listing_events for pre-trigger history.
Climate risk First Street
- Flood 1/10 Low 0% chance over 30 yrs
- Wildfire 4/10 Moderate
- Heat 4/10 Moderate 7 d/yr ≥105°F today · 21 d/yr by 30 yrs out
- Wind 2/10 Low 3% chance of damaging wind over 30 yrs
- Air quality 1/10 Low 0 unhealthy d/yr today · 0 by 30 yrs out
Nearby sold comps map
Loading sold comps map…
Walkable amenities ~0.75 mi
Loading nearby amenities…
Taxation est. · year 1
- Rental income
- $11,482
- − Mortgage interest
- −$8,458
- − Property taxes
- −$2,265
- − Insurance
- −$755
- − Repairs & maintenance
- −$919
- − Management
- −$919
- − Depreciation
- −$4,393
- Taxable loss
- −$6,226
- Est. tax savings @ 24.0%
- +$1,494
- After-tax cash flow
- $-1,957/yr
For passive investors: Depreciation is non-cash, so a rental often shows a tax loss while cash-flowing — sheltering income. Rental losses are passive: they offset passive income freely, and up to $25,000/yr can offset ordinary (W-2) income if you actively participate and your MAGI is under $100k (phasing out to $0 by $150k); unused losses carry forward. On sale, claimed depreciation is recaptured at up to 25%, and gains may owe capital-gains tax (a 1031 exchange can defer both). Figures are a year-1 estimate at your 24.0% rate — not tax advice; consult a CPA.
Condition & rehab AI · 13 photos
This manufactured home requires moderate repairs and maintenance, including painting, flooring, and exterior siding. Upgrading these areas will significantly improve its resale and rental value.
Repairs flagged
- Major Paint — Paint is chipping and faded in multiple areas.
- Major Flooring — Carpeted floors in living areas appear worn.
- Moderate Exterior Siding — Siding appears weathered.
Value-add opportunities
- Both Painting and repainting the exterior and interior — Fresh paint will improve curb appeal and interior aesthetics, attracting more buyers and renters.
- Both New flooring — Replacing worn carpet with hardwood or tile flooring will enhance the home's value and appeal.
Renovation cost estimate screening
| Repair item | Severity | Est. cost |
|---|---|---|
| Paint · Paint is chipping and faded in multiple areas. | Major | $15,000–50,000 |
| Flooring · Carpeted floors in living areas appear worn. | Major | $15,000–50,000 |
| Exterior Siding · Siding appears weathered. | Moderate | $3,000–15,000 |
| Total estimated repair cost · 3 items | $33,000–115,000 |
Value-add ROI direction
- Both Painting and repainting the exterior and interior — Fresh paint will improve curb appeal and interior aesthetics, attracting more buyers and renters. ↑
- Both New flooring — Replacing worn carpet with hardwood or tile flooring will enhance the home's value and appeal. ↑
ⓘ Cost ranges are severity-bucket heuristics (US national rule-of-thumb). Get contractor quotes + a written scope before underwriting a rehab budget.
Schools (NCES district)
- District
- Woodland R-IV
- NCES district ID
- 2919350
- Math proficiency
- 27% ▼ -10.00%
- Reading proficiency
- 42% ▼ -2.00%
- Median HH income
- $32,564
- Composite
- 28.21/100
- National rank
- #6804
- State rank
- #239 of 324 in MO
Livability — Marble Hill
- Score
- 60/100
- State rank
- #508
- US rank
- #19511
Category grades
Schools grade is shown separately in the Schools card above.
Census & demographics
- Population (ZIP)
- 4,568
Population outlook (Bollinger County) Hauer SSP2
- Today (2025)
- 11,825 people
- By 2030
- 11,546 · -2.4%
- By 2040
- 10,935 · -7.5%
- By 2050
- 10,222 · -13.6%
- By 2075
- 8,396 · -29.0%
- By 2100
- 6,530 · -44.8%
Race, ethnicity, and origin ACS 2023
- Neighborhood character
- Predominantly White (89%)
- Race & ethnicity
- White 89% Two or more races 6% Hispanic / Latino 3% Black 1%
- Common ancestry
- Iranian 5% Lithuanian 3% Serbian 2%
- Foreign-born
- 0%
Political lean MEDSL · Bollinger
- 2024 margin
- Solid R (+74.8) · D 12.3% · R 87.1%
- 2008→2024 swing
- -35.4pp toward R · 2008: -39.5pp · 2024: -74.8pp
- All cycles
- 2024: R+74.8 2020: R+73.8 2016: R+72.7 2012: R+52.8 2008: R+39.5
Not yet ingested
- Civics
- —
Market trends
- HPI YoY
- —
- Current HPI
- —
- Rent YoY
- —
- Metro
- —
- State GDP YoY
- ▲ 1.84%
- F500 in state
- 20
Industry mix (Fortune 500 HQ in MO)
| Industry | F500 HQs | Revenue |
|---|---|---|
| Healthcare | 1 | $163B |
|
||
| Insurance | 1 | $21B |
|
||
| Industrial Technology | 1 | $17B |
|
||
| Retail | 1 | $16B |
|
||
| Industrial Distribution | 1 | $10B |
|
||
| Utilities | 1 | $9B |
|
||
Price history
1 event — show timeline
- 2026-05-30 Listed $151,000 MARIS as Distributed by MLS Grid
Cash-flow waterfall
monthlySold comps — $/sqft
last 12 mo · ≤1 miLoading sold comps…