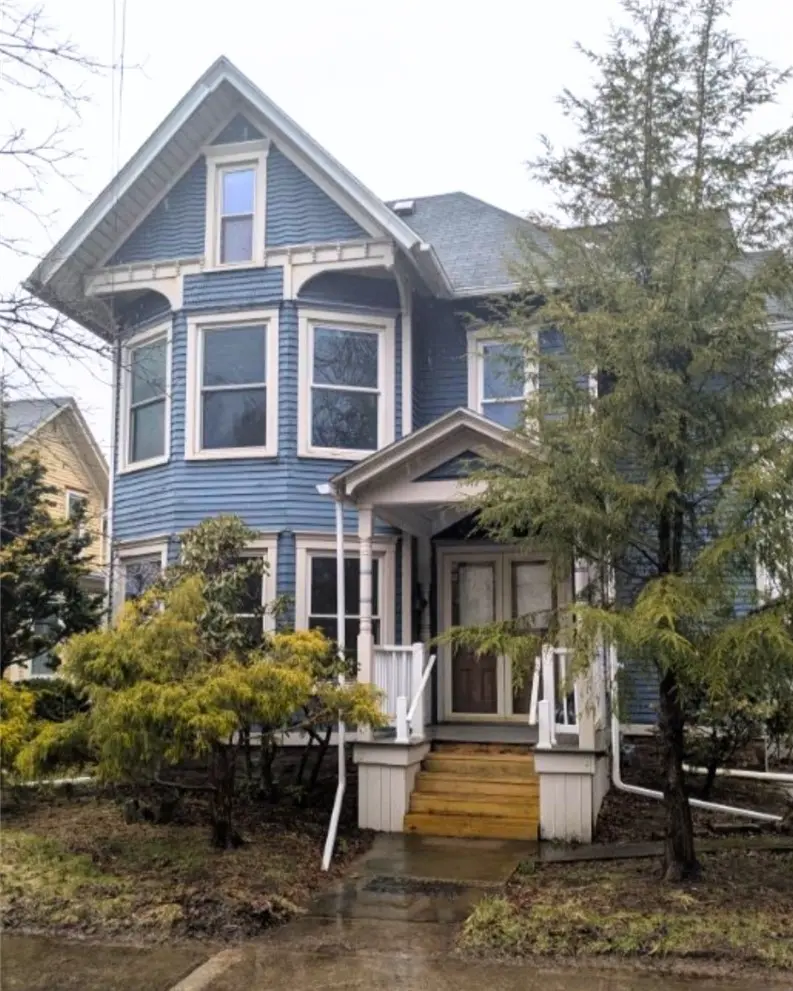
33 South Ave
Brockport, NY 14420
$184,900C+
4 bd · 1.5 ba ·
2,239 sqft ·
Built 1900
· SingleFamily
· Pending
· 12 DOM
Cashflow @ list (25.0% down · 7.5%)
Estimated rent
$2,021/mo
Mortgage (P&I)
−$970
Tax + insurance
−$308
HOA
−$0
Vac / Maint / Mgmt
−$424
Net cashflow
$319/mo
Annual
$3,823/yr
Cap rate
8.36%
Cash-on-cash
7.38%
DSCR
1.33
1% rule
1.09%
Cash to close
$51,772
Investor read
- This is a 4-bed/1.5-bath single-family listed at $185k.
- At list price, monthly cash flow is $319 ($4k/yr) — positive.
- The deal already cash-flows at list — no discount required.
- Meets the 1% rule at list price ($2k rent vs $185k).
- Only 12 days on market — expect competitive offers; lowballing is unlikely to land.
- Local home prices are declining (-3.0%/yr); year-one equity from $1k of loan paydown is wiped out by about $6k of value loss. Plan a longer hold.
- Location reads 73/100 on livability (#313 in NY) — a middle-class / working-renter tenant base. Strengths: health & safety A+, cost of living A, housing A; Watch: employment D+, crime F, amenities F.
- Brockport Central School District (town): math 45% / reading 55% proficiency, ranked #369 of 590 in NY (top 62%) — acceptable for families but not a draw, mixed tenant base, ~2y average lease.
- Zoned schools: Ginther Elementary School (535 students, 44% FRL); A D Oliver Middle School (math 27% / reading 58%, grade D-, #373 of 729 statewide, top 52%, 685 students, 48% FRL); Brockport High School (math 97% / reading 77%, grade A, #311 of 1,100 statewide, top 30%, 946 students, 43% FRL).
- Zoned-school proficiency averages 65% at this address vs 50% district-wide (+15 pts) — the actual schools serving this property are materially stronger than the Brockport Central School District average implies; a family-tenant draw the district grade alone would hide.
- Watch-outs: built in 1900 — expect roof / HVAC / electrical / plumbing capex.
- Market conditions: Rents rising (+2.7%/yr); 79 active listings in the ZIP; solid renter incomes; 1,169 units permitted in Monroe County in 2024 (591 in 5+ unit buildings).
- Monroe County population projected to shrink 6% by 2050 — rents likely to lag national; underwrite the cash flow, not the appreciation.
- 2 sale attempts with the ask held roughly flat each time — persistent listings suggest the price (not the market) is what's stuck; bring a comps-based counter.
- Cap rate 8.4% vs local median 5.1% in Brockport — top-decile yield for the area; either an underpriced asset or a hidden risk that comps aren't pricing in. Stress-test before assuming the spread holds.
- This rent runs 32% of the median local income ($76k/yr) — at the standard rent-burdened threshold; future hikes will face affordability resistance.
Questions for listing agent
- Built in 1900 — when were the roof, HVAC, electrical panel, plumbing, and water heater last replaced?
- Is there a deadline driving the sale (1031 exchange, divorce, estate, relocation)? That informs how much negotiation room exists.
- Schools are A-rated — typically a magnet for longer-tenancy family renters. What's the average tenant stay here, and is there a school-zone premium baked into asking?
- Crime grade is F in this area — have there been break-ins, vandalism, or insurance claims at this property in the last 3 years? What carrier currently insures it and at what premium?
- What's the average days-on-market for RENTAL listings here right now (not sales)? A rising rental-DOM trend means longer vacancies and softer asking-rent achievability than the comps imply.
- What's the recent tenant-quality profile in this submarket — average credit score on applications, eviction rate, late-payment / NSF rate, and stable-employment percentage? A property-management company in the area should have these aggregated.
- How much new for-sale + rental construction is in the pipeline within 1–3 miles? Heavy new supply typically softens prices + rents 12–24 months out; constrained supply supports both.
CashFlowRE · CFR-53HJA73QYNKD27
· Data 4 weeks ago
cashflowre.app · 2026-05-29