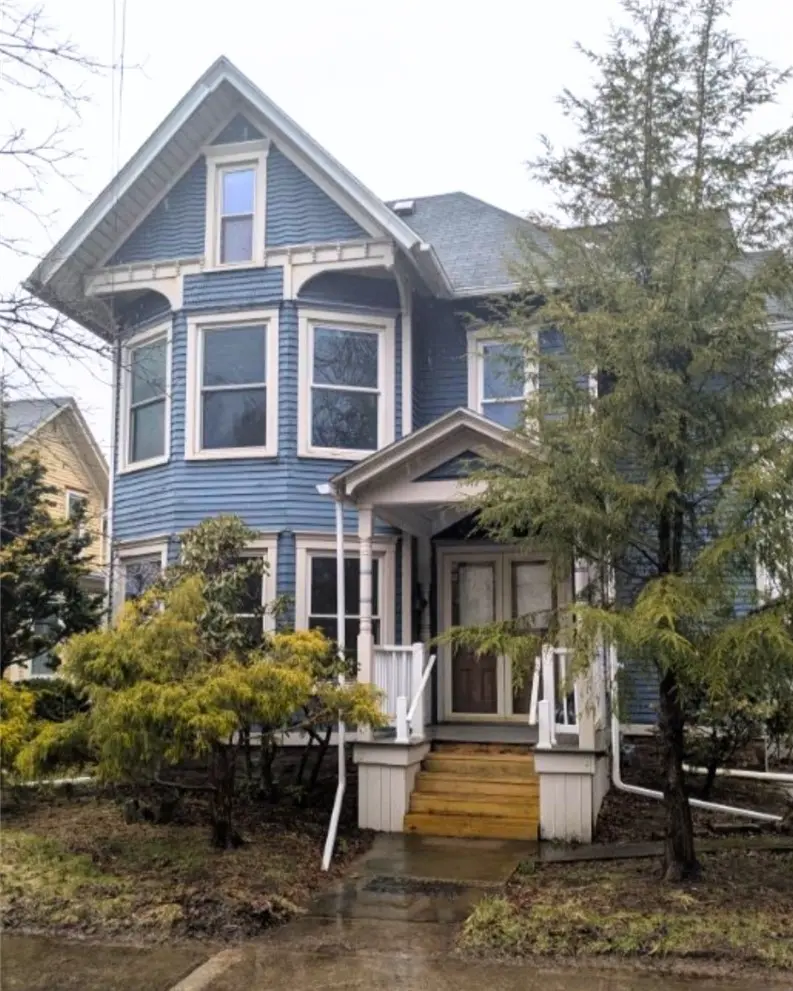
33 South Ave · Brockport, NY
Flood risk No data
- FEMA flood zone
- —
- Chance of flooding over 30 yrs
- —
- Est. flood insurance / yr
- —
Fire risk No data
- Est. fire insurance / yr
- —
Heat risk No data
- Hot days now (above threshold)
- —
- Hot days in 30 yrs
- —
Wind risk No data
- Chance of severe wind over 30 yrs
- —
Air-quality risk No data
- Unhealthy air days now
- —
- Unhealthy air days in 30 yrs
- —
Risk factors via First Street. Map © Google.
Why this score? — see what drove the C+ grade
The composite is a weighted blend of 9 inputs, each scored 0–100. Each bar is that input's sub-score; the figure is the points it added to the 100-point composite (weight × sub-score).
- Cash flow +22.7/30.0
- ARV discount +15.0/15.0
- DSCR +7.3/10.0
- 1% rule +5.9/10.0
- Schools +4.3/10.0
- Livability +3.7/5.0
- Rent growth +3.2/5.0
- Condition / age +2.5/5.0
- Appreciation +0.0/10.0
$184,900
🖨 Deal sheet (PDF) 📄 Offer letter ✓ Due diligence
Listing remarks
Come see this spacious home filled with historic charm in the heart of Brockport! You’ll be welcomed by a stunning entryway featuring beautiful woodwork and original hardware that highlight the home’s timeless character. Large, updated windows throughout fill the home with abundant natural sunlight. Enjoy peace of mind with major updates including the heating system and hot water replaced in 2020. Abundant storage throughout, including a large walk-in closet off the formal dining room and two pantries in the open kitchen. Upstairs, you’ll find four generously sized bedrooms, plus a huge partially finished attic—perfect for a rec room, home office, or additional livin
Key facts
- Stunning entryway
- Original hardware
- Updated windows
Tags
Property features AI
Exterior
- Parking: Detached garage; 2 garage spaces
- Utilities: Electricity connected (fuse panel); Public water connected; Sewer connected
- Home design: 2-story home; Existing condition
- Construction: Asphalt roof; Wood siding; Stone foundation; Attic/crawl hatchway(s) insulated; Copper and PEX plumbing
- Exterior features: Blacktop driveway; Enclosed porch; Porch; Fully fenced yard; Full lot fencing; Near public transit; Rectangular lot
Interior
- Kitchen: Dishwasher; Gas oven; Gas range; Microwave; Refrigerator
- Flooring: Hardwood; Laminate; Luxury vinyl; Vinyl; Varied flooring
- Bathrooms: 1 full bathroom; 1 half bathroom; One main-level bathroom
- Heating & cooling: Gas forced-air heating
- Interior features: Skylights; Thermal windows; Cedar closets; Ceiling fans; Separate/formal dining room; Separate/formal living room; Pantry; Storage; Programmable thermostat
- Laundry & utility: Main-level laundry; Washer; Dryer; Gas water heater
Neighborhood map
What this means for you Summary
Snapshot
- This is a 4-bed/1.5-bath single-family listed at $185k.
Deal economics
- At list price, monthly cash flow is $319 ($4k/yr) — positive.
- The deal already cash-flows at list — no discount required.
- Meets the 1% rule at list price ($2k rent vs $185k).
- Cap rate 8.4% vs local median 5.1% in Brockport — top-decile yield for the area; either an underpriced asset or a hidden risk that comps aren't pricing in. Stress-test before assuming the spread holds.
Location & tenants
- Location reads 73/100 on livability (#313 in NY) — a middle-class / working-renter tenant base. Strengths: health & safety A+, cost of living A, housing A; Watch: employment D+, crime F, amenities F.
- Brockport Central School District (town): math 45% / reading 55% proficiency, ranked #369 of 590 in NY (top 62%) — acceptable for families but not a draw, mixed tenant base, ~2y average lease.
- Market conditions: Rents rising (+2.7%/yr); 79 active listings in the ZIP; solid renter incomes; 1,169 units permitted in Monroe County in 2024 (591 in 5+ unit buildings).
- This rent runs 32% of the median local income ($76k/yr) — at the standard rent-burdened threshold; future hikes will face affordability resistance.
Forward outlook
- Local home prices are declining (-3.0%/yr); year-one equity from $1k of loan paydown is wiped out by about $6k of value loss. Plan a longer hold.
- Monroe County population projected to shrink 6% by 2050 — rents likely to lag national; underwrite the cash flow, not the appreciation.
Negotiation context
- Only 12 days on market — expect competitive offers; lowballing is unlikely to land.
- 2 sale attempts with the ask held roughly flat each time — persistent listings suggest the price (not the market) is what's stuck; bring a comps-based counter.
Risks & watch-outs
- Watch-outs: built in 1900 — expect roof / HVAC / electrical / plumbing capex.
Questions for the listing agent
- Built in 1900 — when were the roof, HVAC, electrical panel, plumbing, and water heater last replaced?
- Is there a deadline driving the sale (1031 exchange, divorce, estate, relocation)? That informs how much negotiation room exists.
- Schools are A-rated — typically a magnet for longer-tenancy family renters. What's the average tenant stay here, and is there a school-zone premium baked into asking?
- Crime grade is F in this area — have there been break-ins, vandalism, or insurance claims at this property in the last 3 years? What carrier currently insures it and at what premium?
- What's the average days-on-market for RENTAL listings here right now (not sales)? A rising rental-DOM trend means longer vacancies and softer asking-rent achievability than the comps imply.
- What's the recent tenant-quality profile in this submarket — average credit score on applications, eviction rate, late-payment / NSF rate, and stable-employment percentage? A property-management company in the area should have these aggregated.
- How much new for-sale + rental construction is in the pipeline within 1–3 miles? Heavy new supply typically softens prices + rents 12–24 months out; constrained supply supports both.
Investment metrics
- 1% rule
- 1.09% ✓
- Cap rate
- 8.36%
- Cash-on-cash
- 7.38%
- DSCR
- 1.33
- GRM
- 7.6
CMA / ARV
- ARV (on-the-fly)
- $308,982
- Comps found
- 12
Show comp detail 12 sales within ~0.75 mi
| Address | Dist | Beds/Ba | Sqft | Sold | Price | $/sf | Match |
|---|---|---|---|---|---|---|---|
| 8 Trefoil Ln | 0.45mi | 4/2.0 | 2,189 (-2%) | 2mo | $302,000 | $138 | 71 |
| 11 Keystone Ct | 0.40mi | 4/2.5 | 2,184 (-2%) | 8mo | $292,000 | $134 | 67 |
| 40 College St | 0.27mi | 3/1.5 (-1) | 2,356 (+5%) | 10mo | $324,000 | $138 | 65 |
| 22 Coleman Creek Rd | 0.30mi | 4/2.0 | 1,950 (-13%) | 2mo | $267,055 | $137 | 61 |
| 11 Brockway Pl | 0.12mi | 3/2.0 (-1) | 1,904 (-15%) | 3mo | $190,000 | $100 | 60 |
| 6 Keystone Ct | 0.36mi | 3/2.5 (-1) | 2,310 (+3%) | 11mo | $305,000 | $132 | 59 |
| 51 College St | 0.26mi | 5/2.0 (+1) | 2,568 (+15%) | 4mo | $225,000 | $88 | 53 |
| 1 Hickory | 0.70mi | 3/2.5 (-1) | 2,170 (-3%) | 0mo | $341,000 | $157 | 53 |
| 31 Fairview Dr | 0.66mi | 5/2.0 (+1) | 2,191 (-2%) | 8mo | $201,000 | $92 | 52 |
| 46 Chappell St | 0.25mi | 5/2.5 (+1) | 1,904 (-15%) | 10mo | $320,000 | $168 | 46 |
| 21 Tudor Rd | 0.47mi | 5/3.5 (+1) | 2,016 (-10%) | 7mo | $332,000 | $165 | 43 |
| 62 Crestview Dr | 0.59mi | 3/1.5 (-1) | 1,987 (-11%) | 12mo | $325,000 | $164 | 39 |
Match score weights: distance 35% · size 25% · config 20% · recency 20%. Top-matched comps best support the ARV.
Projected returns pro-forma
-3.0% appreciation · 2.72% rent growth · sell at horizon
- IRR
- -5.3%
- Equity multiple
- 0.80×
- Total profit
- $-10,207
- Equity at exit
- $27,569
- IRR
- 4.0%
- Equity multiple
- 1.29×
- Total profit
- $15,049
- Equity at exit
- $15,987
Cash invested: $51,772 (down + closing). Projections, not guarantees.
Landlord ↔ Tenant lean methodology
- Overall (STATE)
- 15 Strongly Tenant-Friendly
- State New York
- 15 Strongly Tenant-Friendly · D+10
- County
- — inherits STATE
- City
- — inherits STATE
ZIP-level market 14420
- Home prices YoY
- -10.6%
- Rents YoY
- 2.7%
- Active inventory
- 79
- Price-to-rent
- 7.6×
Monthly cashflow live
- Estimated rent
- $2,021 medium interval (Pro) →
- Mortgage (P&I)
- −$970
- Tax est. 1.5%
- −$231 /mo · $2,774/yr
- Insurance
- −$77
- HOA
- −$0
- Vacancy / Maint / Mgmt
- −$424
- Net cashflow
- $319
Break-even live
Sensitivity live
| Price | -10% $446 | -5% $382 | +0% $319 | +5% $255 | +10% $191 |
|---|---|---|---|---|---|
| Rent | -10% $159 | -5% $239 | +0% $319 | +5% $398 | +10% $478 |
| Rate | -1.0pp $412 | -0.5pp $366 | base $319 | +0.5pp $271 | +1.0pp $222 |
UW: 25.0% down · 7.5% · 30yr · 1.5% tax · 5.0% vac · 8.0% maint · 8.0% mgmt
Financing live
Cash to close
- Down payment
- $46,225
- Closing costs
- $5,547
- Reserves months
- —
- Total cash needed
- —
Loan-product check · same deal, 3 products live
Conventional
25% down · 7.5% · 30yr
- Down + closing
- —
- Monthly P&I
- —
- Monthly cashflow
- —
- DSCR
- —
- Eligible?
- —
Personal DTI + credit; lowest rate.
DSCR
20% down · 8.5% · 30yr
- Down + closing
- —
- Monthly P&I
- —
- Monthly cashflow
- —
- DSCR
- —
- Eligible?
- —
No personal income docs; deal must DSCR.
Hard money
10% down · 12.0% · 12mo
- Down + closing
- —
- Monthly P&I
- —
- Monthly cashflow
- —
- DSCR
- —
- Eligible?
- —
Short-term bridge; refi at stabilization.
Listing history 5 events
-
2026-04-21status Pending
-
2026-04-09$184,900 Active
-
2026-04-01status Pending
-
2026-04-01historical
-
2026-03-25$189,900 Active
ⓘ Source: listings_history table (triggers on properties + properties_extension) + one-shot
backfill from property_details.listing_events for pre-trigger history.
Nearby sold comps map
Loading sold comps map…
Walkable amenities ~0.75 mi
Loading nearby amenities…
Taxation est. · year 1
- Rental income
- $24,249
- − Mortgage interest
- −$10,357
- − Property taxes
- −$2,774
- − Insurance
- −$924
- − Repairs & maintenance
- −$1,940
- − Management
- −$1,940
- − Depreciation
- −$5,379
- Taxable income
- $935
- Est. tax owed @ 24.0%
- −$224
- After-tax cash flow
- $3,599/yr
For passive investors: Depreciation is non-cash, so a rental often shows a tax loss while cash-flowing — sheltering income. Rental losses are passive: they offset passive income freely, and up to $25,000/yr can offset ordinary (W-2) income if you actively participate and your MAGI is under $100k (phasing out to $0 by $150k); unused losses carry forward. On sale, claimed depreciation is recaptured at up to 25%, and gains may owe capital-gains tax (a 1031 exchange can defer both). Figures are a year-1 estimate at your 24.0% rate — not tax advice; consult a CPA.
Schools (NCES district)
- District
- Brockport Central School District
- NCES district ID
- 3605580
- Math proficiency
- 45% ▼ -14.00%
- Reading proficiency
- 55% ▲ 1.00%
- Median HH income
- $55,571
- Composite
- 43.28/100
- National rank
- #3044
- State rank
- #369 of 590 in NY
Livability — Brockport
- Score
- 73/100
- State rank
- #313
- US rank
- #5216
Category grades
Schools grade is shown separately in the Schools card above.
Census & demographics
- Census place
- Brockport, NY
- County
- Monroe County · 674,131 people
- City population
- 20,375
- Metro
- Rochester, NY
- Population (ZIP)
- 20,375
- Household income
- $75,577
- Rent vs Own
- Severe rent burden
- 472.0
Population outlook (Monroe County) Hauer SSP2
- Today (2025)
- 759,460 people
- By 2030
- 757,154 · -0.3%
- By 2040
- 740,644 · -2.5%
- By 2050
- 714,443 · -5.9%
- By 2075
- 645,883 · -15.0%
- By 2100
- 547,084 · -28.0%
Race, ethnicity, and origin ACS 2023
- Neighborhood character
- Predominantly White (81%)
- Race & ethnicity
- White 81% Hispanic / Latino 7% Black 5% Two or more races 5% Asian 2%
- Hispanic origin (detail)
- Puerto Rican 3%
- Common ancestry
- Romanian 5% Lithuanian 2% Italian 2%
- Foreign-born
- 5% · Canada, China, South Korea
- Languages at home
- 90% English-only · Spanish 5% Other Indo-European 1% French/Haitian/Cajun 1%
Political lean MEDSL · Monroe
- 2024 margin
- D (+19.1) · D 59.5% · R 40.5%
- 2008→2024 swing
- +1.4pp toward D · 2008: 17.7pp · 2024: 19.1pp
- All cycles
- 2024: D+19.1 2020: D+21.0 2016: D+14.1 2012: D+17.4 2008: D+17.7
Not yet ingested
- Civics
- —
Market trends
- HPI YoY
- ▼ -31.08%
- Current HPI
- 261.3695
- Rent YoY
- ▲ 2.72%
- Metro
- Rochester, NY
- State GDP YoY
- ▲ 2.60%
- F500 in state
- 92
Industry mix (Fortune 500 HQ in NY)
| Industry | F500 HQs | Revenue |
|---|---|---|
| Financial Services | 10 | $950B |
|
||
| Consumer Goods | 9 | $162B |
|
||
| Insurance | 4 | $225B |
|
||
| Telecommunications | 2 | $144B |
|
||
| Pharmaceuticals | 2 | $112B |
|
||
| Media / Entertainment | 2 | $69B |
|
||
Price history
-2.6% since first listed5 events — show timeline
- 2026-04-21 Pending — UNYREIS
- 2026-04-09 Listed $184,900 UNYREIS
- 2026-04-01 Pending — UNYREIS
- 2026-04-01 Listing Removed — UNYREIS
- 2026-03-25 Listed $189,900 UNYREIS
Property tax history
+6.4%/yrLatest (2025): $10,850 · +9.2% YoY. Source: county tax records.
Cash-flow waterfall
monthlySold comps — $/sqft
last 12 mo · ≤1 miLoading sold comps…