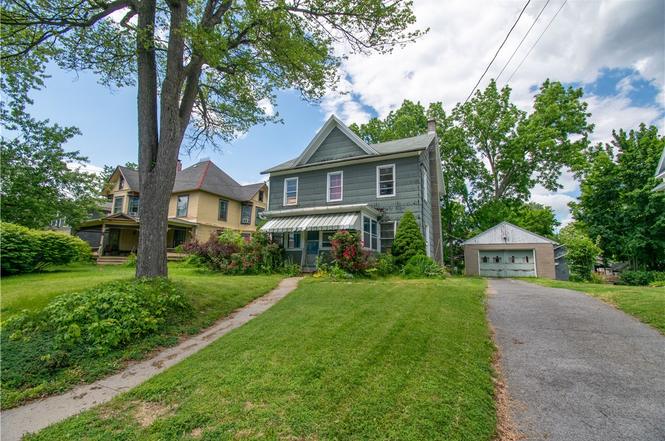
182 Fall St
Seneca Falls, NY 13148
$99,900B
4 bd · 1.5 ba ·
1,740 sqft ·
Built 1840
· SingleFamily
· Active
· 3 DOM
Cashflow @ list (25.0% down · 7.5%)
Estimated rent
$1,416/mo
Mortgage (P&I)
−$524
Tax + insurance
−$350
HOA
−$0
Vac / Maint / Mgmt
−$297
Net cashflow
$244/mo
Annual
$2,932/yr
Cap rate
9.23%
Cash-on-cash
10.48%
DSCR
1.47
1% rule
1.42%
Cash to close
$27,972
Investor read
- This is a 4-bed/1.5-bath single-family listed at $100k.
- At list price, monthly cash flow is $244 ($3k/yr) — positive.
- The deal already cash-flows at list — no discount required.
- Meets the 1% rule at list price ($1k rent vs $100k).
- Only 3 days on market — expect competitive offers; lowballing is unlikely to land.
- Local home prices are declining (-3.0%/yr); year-one equity from $691 of loan paydown is wiped out by about $3k of value loss. Plan a longer hold.
- Location reads 66/100 on livability (#657 in NY) — a middle-class / working-renter tenant base. Strengths: cost of living A+, housing A+, health & safety A; Watch: crime D, amenities D, commute F.
- Seneca Falls Central School District (town): math 46% / reading 53% proficiency, ranked #392 of 590 in NY (top 66%) — families likely to look elsewhere, expect single-tenant / working-renter base with shorter leases.
- Zoned schools: Frank M Knight Elementary School (286 students, 53% FRL); Seneca Falls Middle School (math 22% / reading 47%, grade F, #483 of 729 statewide, top 68%, 277 students, 57% FRL); Mynderse Academy (math 92% / reading 90%, grade A+, #203 of 1,100 statewide, top 20%, 377 students, 47% FRL) — zoned schools average 52% FRL vs 32% district-wide (20 pts higher); higher-poverty schools than district average — tighter screening recommended.
- Zoned-school proficiency averages 63% at this address vs 50% district-wide (+13 pts) — the actual schools serving this property are materially stronger than the Seneca Falls Central School District average implies; a family-tenant draw the district grade alone would hide.
- Watch-outs: property tax is 3.7% of price; built in 1840 — expect roof / HVAC / electrical / plumbing capex.
- Market conditions: 52 active listings in the ZIP; 48 units permitted in Seneca County in 2024 (0 in 5+ unit buildings).
- Seneca County population projected at -14% by 2050 — secular population decline; favor cash flow + early exit over multi-decade hold.
- 3 sale attempts since 11y ago with the ask held roughly flat each time — persistent listings suggest the price (not the market) is what's stuck; bring a comps-based counter.
- Current owner paid $65k; list at $100k implies a 53% gain — meaningful room to come down on a strong offer.
- Cap rate 9.2% vs local median 3.6% in Seneca Falls — top-decile yield for the area; either an underpriced asset or a hidden risk that comps aren't pricing in. Stress-test before assuming the spread holds.
Questions for listing agent
- Built in 1840 — when were the roof, HVAC, electrical panel, plumbing, and water heater last replaced?
- Property tax is high relative to price — has the assessment been appealed recently, and will the sale trigger a re-assessment?
- Is there a deadline driving the sale (1031 exchange, divorce, estate, relocation)? That informs how much negotiation room exists.
- Crime grade is D in this area — have there been break-ins, vandalism, or insurance claims at this property in the last 3 years? What carrier currently insures it and at what premium?
- What's the average days-on-market for RENTAL listings here right now (not sales)? A rising rental-DOM trend means longer vacancies and softer asking-rent achievability than the comps imply.
- What's the recent tenant-quality profile in this submarket — average credit score on applications, eviction rate, late-payment / NSF rate, and stable-employment percentage? A property-management company in the area should have these aggregated.
- How much new for-sale + rental construction is in the pipeline within 1–3 miles? Heavy new supply typically softens prices + rents 12–24 months out; constrained supply supports both.
CashFlowRE · CFR-550ZZ6D8H5NBT7
· Data 14 h ago
cashflowre.app · 2026-05-29