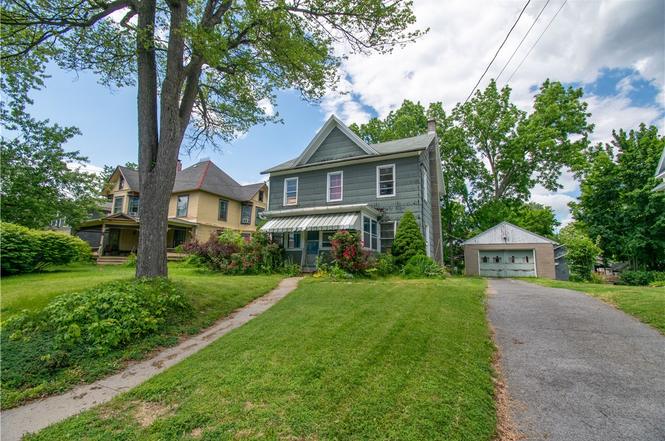
182 Fall St · Seneca Falls, NY
Flood risk 1/10 · Minimal
- FEMA flood zone
- X
- Chance of flooding over 30 yrs
- 0.0%
- Est. flood insurance / yr
- $473 – $860
Fire risk 1/10 · Minimal
- Est. fire insurance / yr
- $691 – $1,283
Heat risk 3/10 · Minor
- Hot days now (above 96°F)
- 7 days/yr
- Hot days in 30 yrs
- 16 days/yr
Wind risk 1/10 · Minimal
- Chance of severe wind over 30 yrs
- 0.0%
Air-quality risk 2/10 · Minimal
- Unhealthy air days now
- 0 days/yr
- Unhealthy air days in 30 yrs
- 1 days/yr
Risk factors via First Street. Map © Google.
Why this score? — see what drove the B grade
The composite is a weighted blend of 9 inputs, each scored 0–100. Each bar is that input's sub-score; the figure is the points it added to the 100-point composite (weight × sub-score).
- Cash flow +25.9/30.0
- ARV discount +15.0/15.0
- 1% rule +9.2/10.0
- DSCR +8.7/10.0
- Schools +4.2/10.0
- Livability +3.3/5.0
- Rent growth +2.5/5.0
- Condition / age +2.5/5.0
- Appreciation +0.0/10.0
$99,900
🖨 Deal sheet (PDF) 📄 Offer letter ✓ Due diligence
Listing remarks MLS
This home offers 4/5 bedrooms with hardwood floors, one bedroom being on the first floor. Large eat in kitchen with knotty pine walls. You'll find the same beautiful knotty pine in the living room and in the stairway. Upstairs you'll find a full bath with 3/4 more bedrooms. One would make a nice office or game room. Call for your appointment today.
Key facts
- Local attractions
- Spacious layout
- 7,840 sq ft lot
Tags
Property features AI
Exterior
- Parking: Detached garage; 1 garage space
- Utilities: Public water connected; Sewer connected
- Home design: 2-story existing home
- Construction: Composite siding; Architectural shingle roof; Stone foundation
- Exterior features: Blacktop driveway; Rectangular residential lot; City street frontage
Interior
- Kitchen: Free-standing range; Oven
- Bedrooms: 1 bedroom on the main level
- Flooring: Hardwood; Laminate; Varies
- Bathrooms: 1 full bathroom; 1 half bathroom; 1 main-level bathroom
- Heating & cooling: Gas heating; Baseboard heating; Steam heating
- Interior features: Country kitchen; Pull-down attic stairs; Bedroom on main level; Full basement
- Laundry & utility: Laundry in basement; Gas water heater
Neighborhood map
What this means for you Summary
Snapshot
- This is a 4-bed/1.5-bath single-family listed at $100k.
Deal economics
- At list price, monthly cash flow is $244 ($3k/yr) — positive.
- The deal already cash-flows at list — no discount required.
- Meets the 1% rule at list price ($1k rent vs $100k).
- Cap rate 9.2% vs local median 3.6% in Seneca Falls — top-decile yield for the area; either an underpriced asset or a hidden risk that comps aren't pricing in. Stress-test before assuming the spread holds.
Location & tenants
- Location reads 66/100 on livability (#657 in NY) — a middle-class / working-renter tenant base. Strengths: cost of living A+, housing A+, health & safety A; Watch: crime D, amenities D, commute F.
- Seneca Falls Central School District (town): math 46% / reading 53% proficiency, ranked #392 of 590 in NY (top 66%) — families likely to look elsewhere, expect single-tenant / working-renter base with shorter leases.
- Zoned schools: Frank M Knight Elementary School (286 students, 53% FRL); Seneca Falls Middle School (math 22% / reading 47%, grade F, #483 of 729 statewide, top 68%, 277 students, 57% FRL); Mynderse Academy (math 92% / reading 90%, grade A+, #203 of 1,100 statewide, top 20%, 377 students, 47% FRL) — zoned schools average 52% FRL vs 32% district-wide (20 pts higher); higher-poverty schools than district average — tighter screening recommended.
- Zoned-school proficiency averages 63% at this address vs 50% district-wide (+13 pts) — the actual schools serving this property are materially stronger than the Seneca Falls Central School District average implies; a family-tenant draw the district grade alone would hide.
- Market conditions: 52 active listings in the ZIP; 48 units permitted in Seneca County in 2024 (0 in 5+ unit buildings).
Forward outlook
- Local home prices are declining (-3.0%/yr); year-one equity from $691 of loan paydown is wiped out by about $3k of value loss. Plan a longer hold.
- Seneca County population projected at -14% by 2050 — secular population decline; favor cash flow + early exit over multi-decade hold.
Negotiation context
- Only 3 days on market — expect competitive offers; lowballing is unlikely to land.
- 3 sale attempts since 11y ago with the ask held roughly flat each time — persistent listings suggest the price (not the market) is what's stuck; bring a comps-based counter.
- Current owner paid $65k; list at $100k implies a 53% gain — meaningful room to come down on a strong offer.
Risks & watch-outs
- Watch-outs: property tax is 3.7% of price; built in 1840 — expect roof / HVAC / electrical / plumbing capex.
Questions for the listing agent
- Built in 1840 — when were the roof, HVAC, electrical panel, plumbing, and water heater last replaced?
- Property tax is high relative to price — has the assessment been appealed recently, and will the sale trigger a re-assessment?
- Is there a deadline driving the sale (1031 exchange, divorce, estate, relocation)? That informs how much negotiation room exists.
- Crime grade is D in this area — have there been break-ins, vandalism, or insurance claims at this property in the last 3 years? What carrier currently insures it and at what premium?
- What's the average days-on-market for RENTAL listings here right now (not sales)? A rising rental-DOM trend means longer vacancies and softer asking-rent achievability than the comps imply.
- What's the recent tenant-quality profile in this submarket — average credit score on applications, eviction rate, late-payment / NSF rate, and stable-employment percentage? A property-management company in the area should have these aggregated.
- How much new for-sale + rental construction is in the pipeline within 1–3 miles? Heavy new supply typically softens prices + rents 12–24 months out; constrained supply supports both.
Investment metrics
- 1% rule
- 1.42% ✓
- Cap rate
- 9.23%
- Cash-on-cash
- 10.48%
- DSCR
- 1.47
- GRM
- 5.9
CMA / ARV
- ARV (on-the-fly)
- $180,960
- Comps found
- 12
Show comp detail 12 sales within ~0.75 mi
| Address | Dist | Beds/Ba | Sqft | Sold | Price | $/sf | Match |
|---|---|---|---|---|---|---|---|
| 33 Miller St | 0.04mi | 3/2.0 (-1) | 1,728 (-1%) | 3mo | $21,000 | $12 | 87 |
| 28 Miller St | 0.06mi | 3/2.0 (-1) | 1,774 (+2%) | 3mo | $175,000 | $99 | 84 |
| 10 Prospect St | 0.60mi | 4/1.0 | 1,768 (+2%) | 12mo | $185,000 | $105 | 57 |
| 8 Porter St | 0.64mi | 3/1.5 (-1) | 1,653 (-5%) | 2mo | $138,000 | $83 | 56 |
| 53 Troy St | 0.56mi | 4/1.5 | 1,872 (+8%) | 8mo | $219,900 | $117 | 54 |
| 12 Johnston | 0.67mi | 3/1.5 (-1) | 1,632 (-6%) | 1mo | $170,000 | $104 | 52 |
| 12 Barker St | 0.44mi | 3/1.5 (-1) | 1,576 (-9%) | 8mo | $130,000 | $82 | 52 |
| 9 Boston Ave | 0.66mi | 3/2.0 (-1) | 1,620 (-7%) | 6mo | $152,000 | $94 | 46 |
| 109 State St | 0.60mi | 5/1.5 (+1) | 1,877 (+8%) | 11mo | $211,000 | $112 | 45 |
| 288 Fall St | 0.57mi | 3/1.5 (-1) | 1,539 (-12%) | 10mo | $230,000 | $149 | 40 |
| 49 E Bayard St | 0.61mi | 5/2.0 (+1) | 1,572 (-10%) | 11mo | $149,900 | $95 | 40 |
| 41 Porter St | 0.50mi | 3/1.5 (-1) | 1,488 (-14%) | 11mo | $175,026 | $118 | 38 |
Match score weights: distance 35% · size 25% · config 20% · recency 20%. Top-matched comps best support the ARV.
Projected returns pro-forma
-3.0% appreciation · 3.0% rent growth · sell at horizon
- IRR
- -0.5%
- Equity multiple
- 0.98×
- Total profit
- $-493
- Equity at exit
- $14,895
- IRR
- 9.3%
- Equity multiple
- 1.72×
- Total profit
- $20,152
- Equity at exit
- $8,638
Cash invested: $27,972 (down + closing). Projections, not guarantees.
Landlord ↔ Tenant lean methodology
- Overall (STATE)
- 15 Strongly Tenant-Friendly
- State New York
- 15 Strongly Tenant-Friendly · D+10
- County
- — inherits STATE
- City
- — inherits STATE
ZIP-level market 13148
- Home prices YoY
- -19.6%
- Active inventory
- 52
- Price-to-rent
- 5.9×
Monthly cashflow live
- Estimated rent
- $1,416 medium interval (Pro) →
- Mortgage (P&I)
- −$524
- Tax from tax record
- −$309 /mo · $3,703/yr
- Insurance
- −$42
- HOA
- −$0
- Vacancy / Maint / Mgmt
- −$297
- Net cashflow
- $244
Break-even live
Sensitivity live
| Price | -10% $301 | -5% $273 | +0% $244 | +5% $216 | +10% $188 |
|---|---|---|---|---|---|
| Rent | -10% $132 | -5% $188 | +0% $244 | +5% $300 | +10% $356 |
| Rate | -1.0pp $295 | -0.5pp $270 | base $244 | +0.5pp $218 | +1.0pp $192 |
UW: 25.0% down · 7.5% · 30yr · 1.5% tax · 5.0% vac · 8.0% maint · 8.0% mgmt
Financing live
Cash to close
- Down payment
- $24,975
- Closing costs
- $2,997
- Reserves months
- —
- Total cash needed
- —
Loan-product check · same deal, 3 products live
Conventional
25% down · 7.5% · 30yr
- Down + closing
- —
- Monthly P&I
- —
- Monthly cashflow
- —
- DSCR
- —
- Eligible?
- —
Personal DTI + credit; lowest rate.
DSCR
20% down · 8.5% · 30yr
- Down + closing
- —
- Monthly P&I
- —
- Monthly cashflow
- —
- DSCR
- —
- Eligible?
- —
No personal income docs; deal must DSCR.
Hard money
10% down · 12.0% · 12mo
- Down + closing
- —
- Monthly P&I
- —
- Monthly cashflow
- —
- DSCR
- —
- Eligible?
- —
Short-term bridge; refi at stabilization.
Listing history 4 events
-
2026-06-21days on market $99,900 Active 3 DOM
-
2026-06-21days on market $99,900 Active 2 DOM
-
2026-06-18remarks 699-char remark
-
2026-06-18$99,900 Active 1 DOM
ⓘ Source: listings_history table (triggers on properties + properties_extension) + one-shot
backfill from property_details.listing_events for pre-trigger history.
Tax reassessment forecast NY · Partial reset (capped growth)
- Current annual tax
- $3,703 · $309/mo
- Projected year-2 tax
- $3,703 · $309/mo
- Expected delta
- $0/yr ($0/mo · 0.0%)
ⓘ Screening estimate from a state-policy table — verify with the county assessor before closing.
Climate risk First Street
- Flood 1/10 Low FEMA zone X · 0% chance over 30 yrs
- Wildfire 1/10 Low
- Heat 3/10 Moderate 7 d/yr ≥96°F today · 16 d/yr by 30 yrs out
- Wind 1/10 Low 0% chance of damaging wind over 30 yrs
- Air quality 2/10 Low 0 unhealthy d/yr today · 1 by 30 yrs out
Nearby sold comps map
Loading sold comps map…
Walkable amenities ~0.75 mi
Loading nearby amenities…
Taxation est. · year 1
- Rental income
- $16,989
- − Mortgage interest
- −$5,596
- − Property taxes
- −$3,703
- − Insurance
- −$500
- − Repairs & maintenance
- −$1,359
- − Management
- −$1,359
- − Depreciation
- −$2,906
- Taxable income
- $1,566
- Est. tax owed @ 24.0%
- −$376
- After-tax cash flow
- $2,556/yr
For passive investors: Depreciation is non-cash, so a rental often shows a tax loss while cash-flowing — sheltering income. Rental losses are passive: they offset passive income freely, and up to $25,000/yr can offset ordinary (W-2) income if you actively participate and your MAGI is under $100k (phasing out to $0 by $150k); unused losses carry forward. On sale, claimed depreciation is recaptured at up to 25%, and gains may owe capital-gains tax (a 1031 exchange can defer both). Figures are a year-1 estimate at your 24.0% rate — not tax advice; consult a CPA.
Schools (NCES district)
- District
- Seneca Falls Central School District
- NCES district ID
- 3626430
- Math proficiency
- 46% ▲ 2.00%
- Reading proficiency
- 53% ▲ 17.00%
- Median HH income
- $49,889
- Composite
- 42.34/100
- National rank
- #3253
- State rank
- #392 of 590 in NY
Livability — Seneca Falls
- Score
- 66/100
- State rank
- #657
- US rank
- #12239
Category grades
Schools grade is shown separately in the Schools card above.
Census & demographics
- Census place
- Seneca Falls, NY
- City population
- 10,798
- Population (ZIP)
- 10,798
Population outlook (Seneca County) Hauer SSP2
- Today (2025)
- 33,457 people
- By 2030
- 32,540 · -2.7%
- By 2040
- 30,680 · -8.3%
- By 2050
- 28,875 · -13.7%
- By 2075
- 24,757 · -26.0%
- By 2100
- 19,591 · -41.4%
Race, ethnicity, and origin ACS 2023
- Neighborhood character
- Predominantly White (90%)
- Race & ethnicity
- White 90% Two or more races 3% Hispanic / Latino 2% Black 2% Asian 2%
- Common ancestry
- Romanian 4% Iranian 4% Lithuanian 3%
- Foreign-born
- 3% · Canada, Jamaica
- Languages at home
- 95% English-only · Other Indo-European 3%
Political lean MEDSL · Seneca
- 2024 margin
- R (+11.8) · D 44.1% · R 55.9%
- 2008→2024 swing
- -14.4pp toward R · 2008: 2.6pp · 2024: -11.8pp
- All cycles
- 2024: R+11.8 2020: R+9.1 2016: R+12.1 2012: D+9.2 2008: D+2.6
Not yet ingested
- Civics
- —
Market trends
- HPI YoY
- ▼ -66.62%
- Current HPI
- 273.4852
- Rent YoY
- —
- Metro
- —
- State GDP YoY
- ▲ 2.60%
- F500 in state
- 92
Industry mix (Fortune 500 HQ in NY)
| Industry | F500 HQs | Revenue |
|---|---|---|
| Financial Services | 10 | $950B |
|
||
| Consumer Goods | 9 | $162B |
|
||
| Insurance | 4 | $225B |
|
||
| Telecommunications | 2 | $144B |
|
||
| Pharmaceuticals | 2 | $112B |
|
||
| Media / Entertainment | 2 | $69B |
|
||
Price history
+34.1% since first listed7 events — show timeline
- 2026-06-18 Listed $99,900 UNYREIS
- 2025-11-12 Pending — UNYREIS
- 2025-11-12 Listing Removed — UNYREIS
- 2025-11-06 Listed $129,000 UNYREIS
- 2016-02-18 Sold (Public Records) $65,100 Public Records
- 2016-02-08 Sold (MLS) $65,000 UNYREIS
- 2015-09-04 Listed $74,500 UNYREIS
Property tax history
+2.6%/yrLatest (2025): $3,703 · +6.7% YoY. Source: county tax records.
Cash-flow waterfall
monthlySold comps — $/sqft
last 12 mo · ≤1 miLoading sold comps…