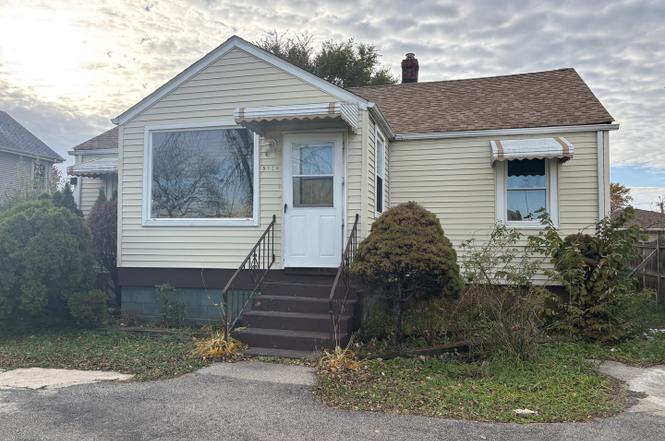
9326 Greenwood Ave
Niles, IL 60016
$250,000D+
3 bd · 1.0 ba ·
1,404 sqft ·
Built 1939
· SingleFamily
· Pending
· 163 DOM
Cashflow @ list (25.0% down · 7.5%)
Estimated rent
$2,409/mo
Mortgage (P&I)
−$1,311
Tax + insurance
−$669
HOA
−$0
Vac / Maint / Mgmt
−$506
Net cashflow
$-77/mo
Annual
$-925/yr
Cap rate
5.92%
Cash-on-cash
-1.32%
DSCR
0.94
1% rule
0.96%
Cash to close
$70,000
Investor read
- This is a 3-bed/1.0-bath single-family listed at $250k.
- At list price, monthly cash flow is $-77 ($-925/yr) — negative.
- To cash-flow at today's rent, offer at most $236k (5.4% below list).
- To meet the 1% rule (rent ≥ 1% of price), the offer needs to be $241k (3.6% below list).
- It's been on market 163 days — a 12% lower offer ($220k) is reasonable based on typical stale-listing flexibility.
- Recommended offer: $220k (12.0% below list) — sets the bar for market timing.
- Local home prices are declining (-3.0%/yr); year-one equity from $2k of loan paydown is wiped out by about $8k of value loss. Plan a longer hold.
- Location reads 83/100 on livability (#53 in IL, #1,001 nationally) — a professional / high-income tenant draw. Strengths: commute A+, amenities A, housing A; Watch: health & safety D+.
- Maine Township Hsd 207 (suburban): math 34% / reading 39% proficiency, ranked #143 of 620 in IL (top 23%) — families likely to look elsewhere, expect single-tenant / working-renter base with shorter leases.
- Zoned schools: Maine East High School (math 26% / reading 31%, grade F, #213 of 693 statewide, top 31%, 1,808 students, 0% FRL).
- Watch-outs: property tax is 2.7% of price; built in 1939 — expect roof / HVAC / electrical / plumbing capex.
- Market conditions: Rents rising fast (+4.7%/yr); 126 active listings in the ZIP; 28 comparable units currently listed for rent nearby; rentals at typical pace (median 17d on market — plan ~3-4 weeks tenant-placement turnaround); solid renter incomes; 6,272 units permitted in Cook County in 2024 (4,658 in 5+ unit buildings).
- 2 sale attempts; this cycle's ask has dropped $65k (21%) from the opening price — seller is motivated, your offer sets the floor, not the list.
- Cap rate 5.9% vs local median 4.4% in Niles — top-decile yield for the area; either an underpriced asset or a hidden risk that comps aren't pricing in. Stress-test before assuming the spread holds.
- This rent runs 33% of the median local income ($87k/yr) — at the standard rent-burdened threshold; future hikes will face affordability resistance.
Questions for listing agent
- What do current leases actually rent for vs. the listed asking? Can we see a recent rent roll and the last 12 months of T-12 income?
- It's been on market 163 days. Have you received any prior offers? Is the seller open to a 12% concession, seller financing, or rate buy-down credit?
- Built in 1939 — when were the roof, HVAC, electrical panel, plumbing, and water heater last replaced?
- Property tax is high relative to price — has the assessment been appealed recently, and will the sale trigger a re-assessment?
- Why hasn't it sold? Are there any deal-killer items the seller is aware of (foundation, flood, title, zoning, code violations)?
- Is there a deadline driving the sale (1031 exchange, divorce, estate, relocation)? That informs how much negotiation room exists.
- The area grade is low — what's the realistic commute time and amenity access for the typical tenant pool here? Any planned neighborhood developments (good or bad) we should know about?
- What's the average days-on-market for RENTAL listings here right now (not sales)? A rising rental-DOM trend means longer vacancies and softer asking-rent achievability than the comps imply.
CashFlowRE · CFR-566CVMEJW1FFC8
· Data 1 week ago
cashflowre.app · 2026-05-29