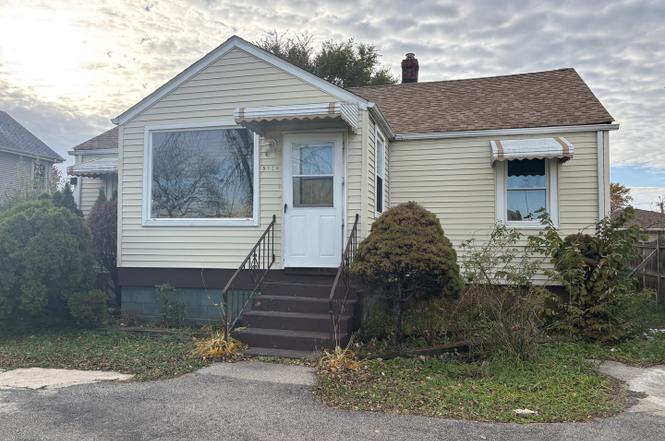
9326 Greenwood Ave · Niles, IL
Flood risk 1/10 · Minimal
- FEMA flood zone
- X (unshaded)
- Chance of flooding over 30 yrs
- 0.0%
- Est. flood insurance / yr
- $473 – $860
Fire risk 1/10 · Minimal
- Est. fire insurance / yr
- $804 – $1,492
Heat risk 3/10 · Minor
- Hot days now (above 99°F)
- 7 days/yr
- Hot days in 30 yrs
- 14 days/yr
Wind risk 2/10 · Minimal
- Chance of severe wind over 30 yrs
- 0.0%
Air-quality risk 4/10 · Minor
- Unhealthy air days now
- 6 days/yr
- Unhealthy air days in 30 yrs
- 7 days/yr
Risk factors via First Street. Map © Google.
Why this score? — see what drove the D+ grade
The composite is a weighted blend of 9 inputs, each scored 0–100. Each bar is that input's sub-score; the figure is the points it added to the 100-point composite (weight × sub-score).
- ARV discount +15.0/15.0
- Cash flow +11.6/30.0
- 1% rule +4.6/10.0
- Livability +4.2/5.0
- Rent growth +3.7/5.0
- DSCR +3.4/10.0
- Schools +3.4/10.0
- Condition / age +2.5/5.0
- Appreciation +0.0/10.0
$250,000
🖨 Deal sheet 📄 Offer letter ✓ Due diligence
Listing remarks
Opportunity knocks - don't wait to put your personal touches on this home and make it yours! Property being sold as-is by the Cook County Public Guardian's office.
Key facts
- 6,762 sq ft lot
- Built 1939
- Listed 163 days
Property features AI
Finance
- HOA & community: No master association fee required
Exterior
- Utilities: Public water; Public sewer
- Home design: Detached single-family home; One-story layout; Fee simple ownership
- Construction: Built approximately 81–90 years ago; Aluminum siding; Property built before 1978
- Exterior features: Lot dimensions approximately 69 x 98; Lot smaller than 0.25 acre
Interior
- Kitchen: Eating area / table space in kitchen
- Bedrooms: 3 bedrooms (all on the main level)
- Flooring: Wood laminate flooring throughout main living areas and bedrooms
- Bathrooms: 4 full bathrooms; Basement bathroom(s) present
- Heating & cooling: Natural gas forced air heating; Central air conditioning
- Interior features: Finished full basement; 8 total rooms
- Laundry & utility: Basement laundry room (8 x 8)
Neighborhood map
What this means for you Summary
Snapshot
- This is a 3-bed/1.0-bath single-family listed at $250k.
Deal economics
- At list price, monthly cash flow is $-77 ($-925/yr) — negative.
- To cash-flow at today's rent, offer at most $236k (5.4% below list).
- To meet the 1% rule (rent ≥ 1% of price), the offer needs to be $241k (3.6% below list).
- Recommended offer: $220k (12.0% below list) — sets the bar for market timing.
- Cap rate 5.9% vs local median 4.4% in Niles — top-decile yield for the area; either an underpriced asset or a hidden risk that comps aren't pricing in. Stress-test before assuming the spread holds.
Location & tenants
- Location reads 83/100 on livability (#53 in IL, #1,001 nationally) — a professional / high-income tenant draw. Strengths: commute A+, amenities A, housing A; Watch: health & safety D+.
- Maine Township Hsd 207 (suburban): math 34% / reading 39% proficiency, ranked #143 of 620 in IL (top 23%) — families likely to look elsewhere, expect single-tenant / working-renter base with shorter leases.
- Zoned schools: Maine East High School (math 26% / reading 31%, grade F, #213 of 693 statewide, top 31%, 1,808 students, 0% FRL).
- Market conditions: Rents rising fast (+4.7%/yr); 126 active listings in the ZIP; 28 comparable units currently listed for rent nearby; rentals at typical pace (median 17d on market — plan ~3-4 weeks tenant-placement turnaround); solid renter incomes; 6,272 units permitted in Cook County in 2024 (4,658 in 5+ unit buildings).
- This rent runs 33% of the median local income ($87k/yr) — at the standard rent-burdened threshold; future hikes will face affordability resistance.
Forward outlook
- Local home prices are declining (-3.0%/yr); year-one equity from $2k of loan paydown is wiped out by about $8k of value loss. Plan a longer hold.
Negotiation context
- It's been on market 163 days — a 12% lower offer ($220k) is reasonable based on typical stale-listing flexibility.
- 2 sale attempts; this cycle's ask has dropped $65k (21%) from the opening price — seller is motivated, your offer sets the floor, not the list.
Risks & watch-outs
- Watch-outs: property tax is 2.7% of price; built in 1939 — expect roof / HVAC / electrical / plumbing capex.
Questions for the listing agent
- What do current leases actually rent for vs. the listed asking? Can we see a recent rent roll and the last 12 months of T-12 income?
- It's been on market 163 days. Have you received any prior offers? Is the seller open to a 12% concession, seller financing, or rate buy-down credit?
- Built in 1939 — when were the roof, HVAC, electrical panel, plumbing, and water heater last replaced?
- Property tax is high relative to price — has the assessment been appealed recently, and will the sale trigger a re-assessment?
- Why hasn't it sold? Are there any deal-killer items the seller is aware of (foundation, flood, title, zoning, code violations)?
- Is there a deadline driving the sale (1031 exchange, divorce, estate, relocation)? That informs how much negotiation room exists.
- The area grade is low — what's the realistic commute time and amenity access for the typical tenant pool here? Any planned neighborhood developments (good or bad) we should know about?
- What's the average days-on-market for RENTAL listings here right now (not sales)? A rising rental-DOM trend means longer vacancies and softer asking-rent achievability than the comps imply.
- What's the recent tenant-quality profile in this submarket — average credit score on applications, eviction rate, late-payment / NSF rate, and stable-employment percentage? A property-management company in the area should have these aggregated.
- How much new for-sale + rental construction is in the pipeline within 1–3 miles? Heavy new supply typically softens prices + rents 12–24 months out; constrained supply supports both.
Investment metrics
- 1% rule
- 0.96% ✗
- Cap rate
- 5.92%
- Cash-on-cash
- -1.32%
- DSCR
- 0.94
- GRM
- 8.6
CMA / ARV
- ARV (on-the-fly)
- $443,664
- Comps found
- 12
Show comp detail 12 sales within ~0.75 mi
| Address | Dist | Beds/Ba | Sqft | Sold | Price | $/sf | Match |
|---|---|---|---|---|---|---|---|
| 9326 Greenwood Ave | 0.00mi | 3/4.0 | 1,404 (0%) | 0mo | $250,000 | $178 | 88 |
| 9275 Clancy Dr | 0.29mi | 3/2.0 | 1,353 (-4%) | 1mo | $431,000 | $319 | 76 |
| 9532 Greenwood Dr | 0.27mi | 2/2.0 (-1) | 1,400 (-0%) | 4mo | $322,000 | $230 | 74 |
| 9388 N Western Ave | 0.26mi | 3/1.5 | 1,407 (+0%) | 15mo | $445,000 | $316 | 73 |
| 9345 N Western Ave | 0.21mi | 4/2.0 (+1) | 1,369 (-2%) | 11mo | $255,000 | $186 | 68 |
| 9276 N Western Ave | 0.26mi | 3/2.0 | 1,259 (-10%) | 4mo | $330,000 | $262 | 63 |
| 9450 Greenwood Ave | 0.17mi | 2/1.0 (-1) | 1,218 (-13%) | 11mo | $306,000 | $251 | 56 |
| 9037 N Chester Ave | 0.34mi | 2/1.5 (-1) | 1,265 (-10%) | 6mo | $411,101 | $325 | 55 |
| 8213 W Lyons St | 0.50mi | 3/3.0 | 1,344 (-4%) | 9mo | $520,000 | $387 | 54 |
| 3241 Ronald Rd | 0.71mi | 3/2.0 | 1,420 (+1%) | 13mo | $460,000 | $324 | 50 |
| 8136 W Davis St | 0.65mi | 4/1.5 (+1) | 1,488 (+6%) | 10mo | $460,000 | $309 | 45 |
| 8361 W Maynard Rd | 0.62mi | 3/2.0 | 1,224 (-13%) | 16mo | $455,000 | $372 | 32 |
Match score weights: distance 35% · size 25% · config 20% · recency 20%. Top-matched comps best support the ARV.
Projected returns pro-forma
-3.0% appreciation · 4.74% rent growth · sell at horizon
- IRR
- -16.2%
- Equity multiple
- 0.42×
- Total profit
- $-40,936
- Equity at exit
- $37,276
- IRR
- -4.6%
- Equity multiple
- 0.67×
- Total profit
- $-22,940
- Equity at exit
- $21,615
Cash invested: $70,000 (down + closing). Projections, not guarantees.
Landlord ↔ Tenant lean methodology
- Overall (STATE)
- 43 Moderately Tenant-Leaning
- State Illinois
- 43 Moderately Tenant-Leaning · D+7
- County
- — inherits STATE
- City
- — inherits STATE
ZIP-level market 60016
- Rents YoY
- 4.7%
- Active inventory
- 126
- Price-to-rent
- 8.6×
Monthly cashflow live
- Estimated rent
- $2,409 high interval (Pro) →
- Mortgage (P&I)
- −$1,311
- Tax from tax record
- −$565 /mo · $6,784/yr
- Insurance
- −$104
- HOA
- −$0
- Vacancy / Maint / Mgmt
- −$506
- Net cashflow
- $-77
Break-even live
UW: 25.0% down · 7.5% · 30yr · 1.5% tax · 5.0% vac · 8.0% maint · 8.0% mgmt
Financing live
Cash to close
- Down payment
- $62,500
- Closing costs
- $7,500
- Reserves months
- —
- Total cash needed
- —
Loan-product check · same deal, 3 products live
Conventional
25% down · 7.5% · 30yr
- Down + closing
- —
- Monthly P&I
- —
- Monthly cashflow
- —
- DSCR
- —
- Eligible?
- —
Personal DTI + credit; lowest rate.
DSCR
20% down · 8.5% · 30yr
- Down + closing
- —
- Monthly P&I
- —
- Monthly cashflow
- —
- DSCR
- —
- Eligible?
- —
No personal income docs; deal must DSCR.
Hard money
10% down · 12.0% · 12mo
- Down + closing
- —
- Monthly P&I
- —
- Monthly cashflow
- —
- DSCR
- —
- Eligible?
- —
Short-term bridge; refi at stabilization.
Rent comps 28 comps
| Address | Beds | Baths | Sqft | Rent | $/sqft | DOM | Units | Dist |
|---|---|---|---|---|---|---|---|---|
| 8975 W Golf Rd Niles, IL | 1.0–2.0 | 1.0–2.0 | 804 | $2,300 | $2.86 | 2d | 1 | 0.49mi |
| 9201 N Milwaukee Ave Niles, IL | 2.0 | 2.0 | 1364 | $2,962 | $2.17 | 24d | 1 | 0.50mi |
| 8961 W Golf Rd Niles, IL | 1.0–2.0 | 1.0–2.0 | 804 | $2,300 | $2.86 | 2d | 1 | 0.50mi |
| 8970 N Parkside Ave #418 Des Plaines, IL | 2.0 | 2.0 | 1100 | $2,250 | $2.05 | 24d | 1 | 0.54mi |
| 8841 Chester Ave Unit 3 Niles, IL | 3.0 | 2.0 | 1600 | $2,700 | $1.69 | 10d | 1 | 0.60mi |
| 8928 Steven Dr Unit 2D Des Plaines, IL | 2.0 | 1.0 | 900 | $1,795 | $1.99 | 24d | 1 | 0.64mi |
| 8058 W Lyons St Unit B Niles, IL | 3.0 | 1.5 | 1200 | $2,800 | $2.33 | 20d | 1 | 0.69mi |
| 1302 Carol St Park Ridge, IL | 2.0 | 1.0 | 900 | $2,000 | $2.22 | 24d | 1 | 0.78mi |
| 9030 Kennedy Dr Des Plaines, IL | 1.0–2.0 | 1.0–1.5 | 770 | $2,029 | $2.64 | 1d | 26 | 0.78mi |
| 1418 Carol St Unit 2 Park Ridge, IL | 2.0 | 1.0 | 1100 | $2,000 | $1.82 | 5d | 1 | 0.79mi |
| 9268 Barberry Ln Des Plaines, IL | 3.0 | 2.5 | 1568 | $3,000 | $1.91 | 16d | 1 | 0.83mi |
| 8544 W Roseview Dr Niles, IL | 3.0 | 2.0 | 1165 | $3,950 | $3.39 | 2d | 1 | 0.90mi |
| 9700 Sumac Rd Des Plaines, IL | 1.0–2.0 | 1.0–2.0 | 950 | $2,120 | $2.23 | 1d | 5 | 0.91mi |
| 8994 Kennedy Dr Unit 1B Des Plaines, IL | 2.0 | 1.0 | 1000 | $1,700 | $1.70 | 24d | 1 | 0.93mi |
| 9717 Bianco Ter Unit E Des Plaines, IL | 2.0 | 1.0 | 900 | $1,800 | $2.00 | 16d | 1 | 0.96mi |
| 9350 Congress Dr Des Plaines, IL | 1.0–2.0 | 1.0–1.5 | 1030 | $1,995 | $1.94 | 3d | 5 | 0.97mi |
| 9407 Bay Colony Dr Unit 2W Des Plaines, IL | 2.0 | 1.0 | 1000 | $1,800 | $1.80 | 24d | 1 | 1.16mi |
| 9439 Bay Colony Dr Unit 3N Des Plaines, IL | 2.0 | 1.0 | 975 | $1,950 | $2.00 | 14d | 1 | 1.19mi |
| 9481 Bay Colony Dr Unit 3N Des Plaines, IL | 2.0 | 1.0 | 1000 | $2,100 | $2.10 | 3d | 1 | 1.29mi |
| 9482 Bay Colony Dr Unit 3N Des Plaines, IL | 2.0 | 1.0 | 1000 | $1,800 | $1.80 | 2d | 1 | 1.32mi |
| 9480 Bay Colony Dr Unit 3S Des Plaines, IL | 2.0 | 1.0 | 1000 | $1,750 | $1.75 | 22d | 1 | 1.32mi |
| 133 James Ct Glenview, IL | 3.0 | 2.0 | 1634 | $3,600 | $2.20 | 24d | 1 | 1.36mi |
| 9446 Bay Colony Dr Unit 1S Des Plaines, IL | 2.0 | 1.0 | 950 | $2,000 | $2.11 | 15d | 1 | 1.37mi |
| 9446 Bay Colony Dr Unit 2S Des Plaines, IL | 2.0 | 1.0 | 1100 | $1,850 | $1.68 | 19d | 1 | 1.37mi |
| 9440 Bay Colony Dr Unit 2E Des Plaines, IL | 2.0 | 1.0 | 1000 | $1,900 | $1.90 | 24d | 1 | 1.39mi |
| 9422 Bay Colony Dr Unit 2W Des Plaines, IL | 2.0 | 1.0 | 1000 | $1,800 | $1.80 | 24d | 1 | 1.40mi |
| 9462 Bay Colony Dr Unit 3rd Floor Des Plaines, IL | 2.0 | 1.0 | 1000 | $1,850 | $1.85 | 24d | 1 | 1.40mi |
| 10020 Holly Ln Des Plaines, IL | 1.0–2.0 | 1.0 | 700 | $1,780 | $2.54 | 2d | 15 | 1.47mi |
Listing history 13 events
-
2026-06-07statusdays on market $250,000 Pending 163 DOM
-
2026-06-04days on market $250,000 Active 162 DOM
-
2026-06-03days on market $250,000 Active 161 DOM
-
2026-06-02days on market $250,000 Active 160 DOM
-
2026-06-01days on market $250,000 Active 159 DOM
-
2026-05-31days on market $250,000 Active 158 DOM
-
2026-05-12price $250,000
-
2026-04-22price $270,000
-
2026-04-21status Active
-
2026-03-12status Pending
-
2026-01-15price $284,900
-
2025-12-09price $295,000
-
2025-11-14$315,000 Active
ⓘ Source: listings_history table (triggers on properties + properties_extension) + one-shot
backfill from property_details.listing_events for pre-trigger history.
Tax reassessment forecast IL · Partial reset (capped growth)
- Current annual tax
- $6,784 · $565/mo
- Projected year-2 tax
- $6,784 · $565/mo
- Expected delta
- $0/yr ($0/mo · 0.0%)
ⓘ Screening estimate from a state-policy table — verify with the county assessor before closing.
Climate risk First Street
- Flood 1/10 Low FEMA zone X (unshaded) · 0% chance over 30 yrs
- Wildfire 1/10 Low
- Heat 3/10 Moderate 7 d/yr ≥99°F today · 14 d/yr by 30 yrs out
- Wind 2/10 Low 0% chance of damaging wind over 30 yrs
- Air quality 4/10 Moderate 6 unhealthy d/yr today · 7 by 30 yrs out
Nearby sold comps map
Loading sold comps map…
Walkable amenities ~0.75 mi
Loading nearby amenities…
Taxation est. · year 1
- Rental income
- $28,913
- − Mortgage interest
- −$14,004
- − Property taxes
- −$6,784
- − Insurance
- −$1,250
- − Repairs & maintenance
- −$2,313
- − Management
- −$2,313
- − Depreciation
- −$7,273
- Taxable loss
- −$5,023
- Est. tax savings @ 24.0%
- +$1,206
- After-tax cash flow
- $281/yr
For passive investors: Depreciation is non-cash, so a rental often shows a tax loss while cash-flowing — sheltering income. Rental losses are passive: they offset passive income freely, and up to $25,000/yr can offset ordinary (W-2) income if you actively participate and your MAGI is under $100k (phasing out to $0 by $150k); unused losses carry forward. On sale, claimed depreciation is recaptured at up to 25%, and gains may owe capital-gains tax (a 1031 exchange can defer both). Figures are a year-1 estimate at your 24.0% rate — not tax advice; consult a CPA.
Schools (NCES district)
- District
- Maine Township Hsd 207
- NCES district ID
- 1724090
- Math proficiency
- 34% ▼ -13.00%
- Reading proficiency
- 39% ▼ -7.00%
- Median HH income
- $79,034
- Composite
- 34.36/100
- National rank
- #5220
- State rank
- #143 of 620 in IL
Livability — Niles
- Score
- 83/100
- State rank
- #53
- US rank
- #1001
Category grades
Schools grade is shown separately in the Schools card above.
Census & demographics
- County
- Cook County · 4,486,803 people
- City population
- 30,305
- Metro
- Chicago-Naperville-Elgin, IL-IN-WI
- Population (ZIP)
- 60,898
- Household income
- $86,571
- Rent vs Own
- Severe rent burden
- 1719.0
Population outlook (Cook County) Hauer SSP2
- Today (2025)
- 5,347,519 people
- By 2030
- 5,357,703 · +0.2%
- By 2040
- 5,324,924 · -0.4%
- By 2050
- 5,230,762 · -2.2%
- By 2075
- 4,785,735 · -10.5%
- By 2100
- 4,188,836 · -21.7%
Race, ethnicity, and origin ACS 2023
- Neighborhood character
- Diverse neighborhood (Simpson 0.65)
- Race & ethnicity
- White 52% Asian 22% Hispanic / Latino 17% Two or more races 10% Black 5%
- Hispanic origin (detail)
- Mexican 12% Puerto Rican 2%
- Common ancestry
- Romanian 13% Subsaharan African 2% Scotch-Irish 2%
- Foreign-born
- 38% · Canada, South Korea, China
- Languages at home
- 49% English-only · Russian/Polish/Slavic 13% Other Indo-European 12% Spanish 11%
Political lean MEDSL · Cook
- 2024 margin
- Solid D (+42.0) · D 70.4% · R 28.4% · Other 1.2%
- 2008→2024 swing
- -11.4pp toward R · 2008: 53.4pp · 2024: 42.0pp
- All cycles
- 2024: D+42.0 2020: D+50.3 2016: D+53.0 2012: D+49.4 2008: D+53.4
Not yet ingested
- Civics
- —
Market trends
- HPI YoY
- ▼ -238.52%
- Current HPI
- 223.0247
- Rent YoY
- ▲ 4.74%
- Metro
- Chicago-Naperville-Elgin, IL-IN-WI
- State GDP YoY
- ▲ 1.59%
- F500 in state
- 60
Industry mix (Fortune 500 HQ in IL)
| Industry | F500 HQs | Revenue |
|---|---|---|
| Insurance | 4 | $201B |
|
||
| Consumer Goods | 4 | $87B |
|
||
| Industrial Machinery | 3 | $64B |
|
||
| Healthcare | 2 | $55B |
|
||
| Retail / Pharmacy | 1 | $148B |
|
||
| Agriculture / Food | 1 | $86B |
|
||
Price history
-20.6% since first listed7 events — show timeline
- 2026-05-12 Price Changed $250,000 MRED as Distributed by MLS Grid
- 2026-04-22 Price Changed $270,000 MRED as Distributed by MLS Grid
- 2026-04-21 Relisted — MRED as Distributed by MLS Grid
- 2026-03-12 Pending — MRED as Distributed by MLS Grid
- 2026-01-15 Price Changed $284,900 MRED as Distributed by MLS Grid
- 2025-12-09 Price Changed $295,000 MRED as Distributed by MLS Grid
- 2025-11-14 Listed $315,000 MRED as Distributed by MLS Grid
Property tax history
+4.6%/yrLatest (2023): $6,784 · +5.9% YoY. Source: county tax records.
Cash-flow waterfall
monthlySold comps — $/sqft
last 12 mo · ≤1 miLoading sold comps…