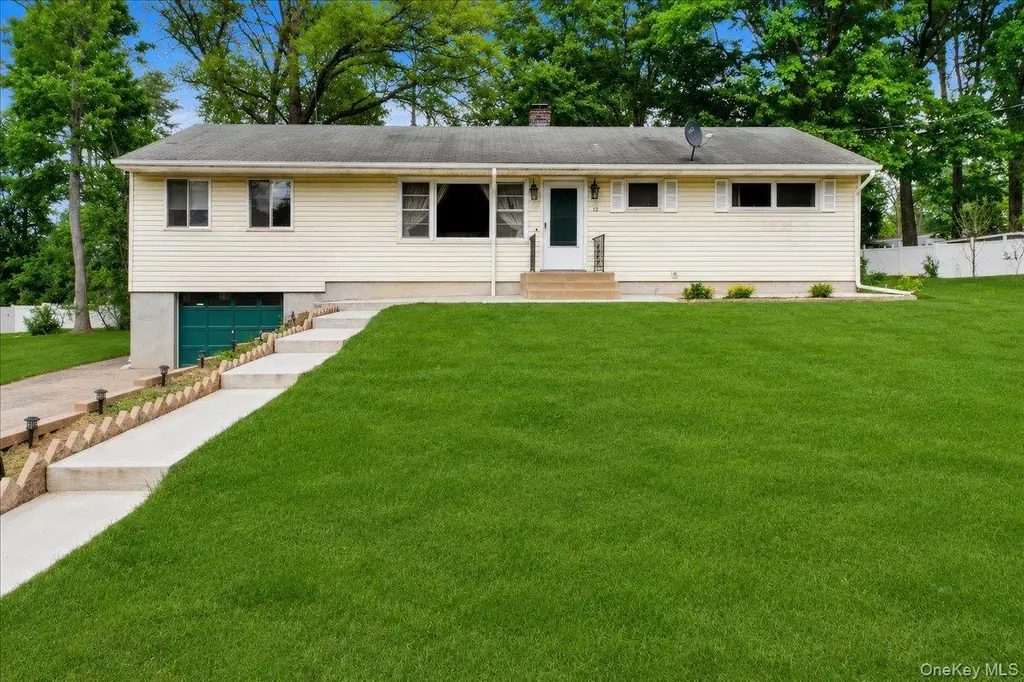
12 Elizabeth Ln
Orange Lake, NY 12553
$299,000D
3 bd · 1.0 ba ·
1,296 sqft ·
Built 1956
· SingleFamily
· Active
· 19 DOM
Cashflow @ list (25.0% down · 7.5%)
Estimated rent
$2,858/mo
Mortgage (P&I)
−$1,568
Tax + insurance
−$595
HOA
−$0
Vac / Maint / Mgmt
−$600
Net cashflow
$95/mo
Annual
$1,138/yr
Cap rate
6.67%
Cash-on-cash
1.36%
DSCR
1.06
1% rule
0.96%
Cash to close
$83,720
Investor read
- This is a 3-bed/1.0-bath single-family listed at $299k.
- At list price, monthly cash flow is $95 ($1k/yr) — positive.
- The deal already cash-flows at list — no discount required.
- To meet the 1% rule (rent ≥ 1% of price), the offer needs to be $286k (4.4% below list).
- It's been on market 19 days — a 2% lower offer ($295k) is reasonable based on typical stale-listing flexibility.
- Recommended offer: $286k (4.4% below list) — sets the bar for 1% rule.
- Local home prices are declining (-3.0%/yr); year-one equity from $2k of loan paydown is wiped out by about $9k of value loss. Plan a longer hold.
- Location reads 60/100 on livability (#972 in NY) — a middle-class / working-renter tenant base. Strengths: employment A+, housing A+; Watch: amenities F, commute F, cost of living F.
- Newburgh City School District (suburban): math 33% / reading 48% proficiency, ranked #500 of 590 in NY (top 85%) — families likely to look elsewhere, expect single-tenant / working-renter base with shorter leases; 61% free/reduced lunch — lower-income household profile, screen leases tightly.
- Zoned schools: Newburgh Free Academy (math 76% / reading 85%, grade A, #506 of 1,100 statewide, top 46%, 3,433 students, 56% FRL).
- Zoned-school proficiency averages 80% at this address vs 40% district-wide (+40 pts) — the actual schools serving this property are materially stronger than the Newburgh City School District average implies; a family-tenant draw the district grade alone would hide.
- Watch-outs: built in 1956 — expect roof / HVAC / electrical / plumbing capex.
- Market conditions: 169 active listings in the ZIP; 1 comparable units currently listed for rent nearby; solid renter incomes; 1,746 units permitted in Orange County in 2024 (1,265 in 5+ unit buildings).
- Cap rate 6.7% vs local median 2.8% in Orange Lake — top-decile yield for the area; either an underpriced asset or a hidden risk that comps aren't pricing in. Stress-test before assuming the spread holds.
- This rent runs 37% of the median local income ($93k/yr) — at the standard rent-burdened threshold; future hikes will face affordability resistance.
Questions for listing agent
- Built in 1956 — when were the roof, HVAC, electrical panel, plumbing, and water heater last replaced?
- Is there a deadline driving the sale (1031 exchange, divorce, estate, relocation)? That informs how much negotiation room exists.
- Schools are D-rated, which usually means shorter tenancies and higher turnover. Who's the typical renter profile here, and what's been the actual vacancy rate?
- The area grade is low — what's the realistic commute time and amenity access for the typical tenant pool here? Any planned neighborhood developments (good or bad) we should know about?
- What's the average days-on-market for RENTAL listings here right now (not sales)? A rising rental-DOM trend means longer vacancies and softer asking-rent achievability than the comps imply.
- What's the recent tenant-quality profile in this submarket — average credit score on applications, eviction rate, late-payment / NSF rate, and stable-employment percentage? A property-management company in the area should have these aggregated.
- How much new for-sale + rental construction is in the pipeline within 1–3 miles? Heavy new supply typically softens prices + rents 12–24 months out; constrained supply supports both.
CashFlowRE · CFR-57R6D4AFMC419K
· Data 2 days ago
cashflowre.app · 2026-05-29