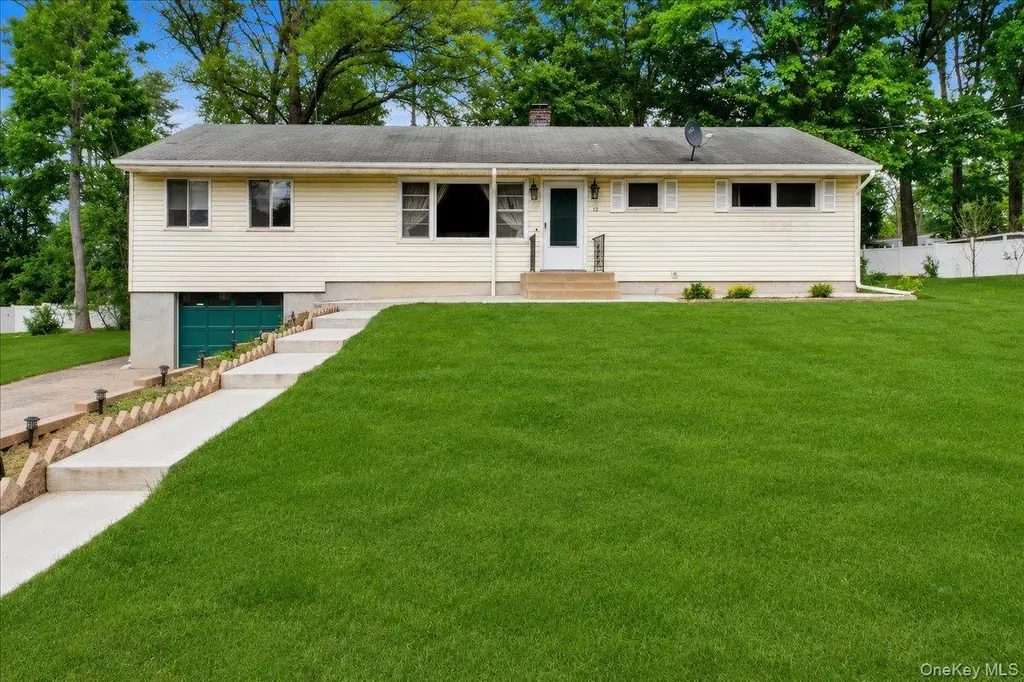
12 Elizabeth Ln · Orange Lake, NY
Flood risk 1/10 · Minimal
- FEMA flood zone
- X (unshaded)
- Chance of flooding over 30 yrs
- 0.0%
- Est. flood insurance / yr
- $473 – $860
Fire risk 3/10 · Minor
- Est. fire insurance / yr
- $691 – $1,283
Heat risk 4/10 · Minor
- Hot days now (above 98°F)
- 7 days/yr
- Hot days in 30 yrs
- 16 days/yr
Wind risk 4/10 · Minor
- Chance of severe wind over 30 yrs
- 14.0%
Air-quality risk 2/10 · Minimal
- Unhealthy air days now
- 1 days/yr
- Unhealthy air days in 30 yrs
- 2 days/yr
Risk factors via First Street. Map © Google.
Why this score? — see what drove the D grade
The composite is a weighted blend of 9 inputs, each scored 0–100. Each bar is that input's sub-score; the figure is the points it added to the 100-point composite (weight × sub-score).
- Cash flow +15.0/30.0
- ARV discount +7.5/15.0
- 1% rule +4.6/10.0
- DSCR +4.6/10.0
- Schools +3.5/10.0
- Livability +3.0/5.0
- Rent growth +2.5/5.0
- Condition / age +2.5/5.0
- Appreciation +0.0/10.0
$299,000
🖨 Deal sheet 📄 Offer letter ✓ Due diligence
Listing remarks MLS
Features a large great room off of kitchen. Great neighborhood for children!
Key facts
- 0.23 acre lot
- Garage
- Built 1956
Property features AI
Exterior
- Parking: Attached underground parking; 1-car garage
- Utilities: Public sewer; Trash collection (public)
- Home design: Single family residence
- Construction: Frame and vinyl siding construction
- Exterior features: Frame construction with vinyl siding; Not waterfront
Interior
- Kitchen: Refrigerator included
- Bedrooms: Includes a first-floor bedroom
- Bathrooms: 1 full bathroom
- Heating & cooling: Hot water heating (oil); Central air conditioning
- Interior features: First-floor bedroom; Partially finished basement with storage space and walk-out access; Unfinished basement area; Pull-down attic stairs; One-level living (single story); 7 total rooms
Neighborhood map
What this means for you Summary
Snapshot
- This is a 3-bed/1.0-bath single-family listed at $299k.
Deal economics
- At list price, monthly cash flow is $95 ($1k/yr) — positive.
- The deal already cash-flows at list — no discount required.
- To meet the 1% rule (rent ≥ 1% of price), the offer needs to be $286k (4.4% below list).
- Recommended offer: $286k (4.4% below list) — sets the bar for 1% rule.
- Cap rate 6.7% vs local median 2.8% in Orange Lake — top-decile yield for the area; either an underpriced asset or a hidden risk that comps aren't pricing in. Stress-test before assuming the spread holds.
Location & tenants
- Location reads 60/100 on livability (#972 in NY) — a middle-class / working-renter tenant base. Strengths: employment A+, housing A+; Watch: amenities F, commute F, cost of living F.
- Newburgh City School District (suburban): math 33% / reading 48% proficiency, ranked #500 of 590 in NY (top 85%) — families likely to look elsewhere, expect single-tenant / working-renter base with shorter leases; 61% free/reduced lunch — lower-income household profile, screen leases tightly.
- Zoned schools: Newburgh Free Academy (math 76% / reading 85%, grade A, #506 of 1,100 statewide, top 46%, 3,433 students, 56% FRL).
- Zoned-school proficiency averages 80% at this address vs 40% district-wide (+40 pts) — the actual schools serving this property are materially stronger than the Newburgh City School District average implies; a family-tenant draw the district grade alone would hide.
- Market conditions: 169 active listings in the ZIP; 1 comparable units currently listed for rent nearby; solid renter incomes; 1,746 units permitted in Orange County in 2024 (1,265 in 5+ unit buildings).
- This rent runs 37% of the median local income ($93k/yr) — at the standard rent-burdened threshold; future hikes will face affordability resistance.
Forward outlook
- Local home prices are declining (-3.0%/yr); year-one equity from $2k of loan paydown is wiped out by about $9k of value loss. Plan a longer hold.
Negotiation context
- It's been on market 19 days — a 2% lower offer ($295k) is reasonable based on typical stale-listing flexibility.
Risks & watch-outs
- Watch-outs: built in 1956 — expect roof / HVAC / electrical / plumbing capex.
Questions for the listing agent
- Built in 1956 — when were the roof, HVAC, electrical panel, plumbing, and water heater last replaced?
- Is there a deadline driving the sale (1031 exchange, divorce, estate, relocation)? That informs how much negotiation room exists.
- Schools are D-rated, which usually means shorter tenancies and higher turnover. Who's the typical renter profile here, and what's been the actual vacancy rate?
- The area grade is low — what's the realistic commute time and amenity access for the typical tenant pool here? Any planned neighborhood developments (good or bad) we should know about?
- What's the average days-on-market for RENTAL listings here right now (not sales)? A rising rental-DOM trend means longer vacancies and softer asking-rent achievability than the comps imply.
- What's the recent tenant-quality profile in this submarket — average credit score on applications, eviction rate, late-payment / NSF rate, and stable-employment percentage? A property-management company in the area should have these aggregated.
- How much new for-sale + rental construction is in the pipeline within 1–3 miles? Heavy new supply typically softens prices + rents 12–24 months out; constrained supply supports both.
Investment metrics
- 1% rule
- 0.96% ✗
- Cap rate
- 6.67%
- Cash-on-cash
- 1.36%
- DSCR
- 1.06
- GRM
- 8.7
CMA / ARV
- ARV (on-the-fly)
- $149,040
- Comps found
- 1
Show comp detail 1 sale within ~0.75 mi
| Address | Dist | Beds/Ba | Sqft | Sold | Price | $/sf | Match |
|---|---|---|---|---|---|---|---|
| 16 Bivona Ln #11 | 0.09mi | 3/2.0 | 1,248 (-4%) | 10mo | $143,000 | $115 | 77 |
Match score weights: distance 35% · size 25% · config 20% · recency 20%. Top-matched comps best support the ARV.
Projected returns pro-forma
-3.0% appreciation · 3.0% rent growth · sell at horizon
- IRR
- -14.1%
- Equity multiple
- 0.49×
- Total profit
- $-42,306
- Equity at exit
- $44,582
- IRR
- -5.2%
- Equity multiple
- 0.66×
- Total profit
- $-28,642
- Equity at exit
- $25,852
Cash invested: $83,720 (down + closing). Projections, not guarantees.
Landlord ↔ Tenant lean methodology
- Overall (STATE)
- 15 Strongly Tenant-Friendly
- State New York
- 15 Strongly Tenant-Friendly · D+10
- County
- — inherits STATE
- City
- — inherits STATE
ZIP-level market 12553
- Home prices YoY
- -31.7%
- Active inventory
- 169
- Price-to-rent
- 8.7×
Monthly cashflow live
- Estimated rent
- $2,858 medium interval (Pro) →
- Mortgage (P&I)
- −$1,568
- Tax from tax record
- −$470 /mo · $5,645/yr
- Insurance
- −$125
- HOA
- −$0
- Vacancy / Maint / Mgmt
- −$600
- Net cashflow
- $95
Break-even live
UW: 25.0% down · 7.5% · 30yr · 1.5% tax · 5.0% vac · 8.0% maint · 8.0% mgmt
Financing live
Cash to close
- Down payment
- $74,750
- Closing costs
- $8,970
- Reserves months
- —
- Total cash needed
- —
Loan-product check · same deal, 3 products live
Conventional
25% down · 7.5% · 30yr
- Down + closing
- —
- Monthly P&I
- —
- Monthly cashflow
- —
- DSCR
- —
- Eligible?
- —
Personal DTI + credit; lowest rate.
DSCR
20% down · 8.5% · 30yr
- Down + closing
- —
- Monthly P&I
- —
- Monthly cashflow
- —
- DSCR
- —
- Eligible?
- —
No personal income docs; deal must DSCR.
Hard money
10% down · 12.0% · 12mo
- Down + closing
- —
- Monthly P&I
- —
- Monthly cashflow
- —
- DSCR
- —
- Eligible?
- —
Short-term bridge; refi at stabilization.
Rent comps 1 comps
| Address | Beds | Baths | Sqft | Rent | $/sqft | DOM | Units | Dist |
|---|---|---|---|---|---|---|---|---|
| 853 Little Britain Rd New Windsor, NY | 3.0 | 1.5 | 1328 | $2,700 | $2.03 | 13d | 1 | 1.09mi |
Listing history 23 events
-
2026-06-18days on market $299,000 Active 19 DOM
-
2026-06-17days on market $299,000 Active 18 DOM
-
2026-06-16days on market $299,000 Active 17 DOM
-
2026-06-15days on market $299,000 Active 16 DOM
-
2026-06-14days on market $299,000 Active 14 DOM
-
2026-06-13days on market $299,000 Active 13 DOM
-
2026-06-10days on market $299,000 Active 11 DOM
-
2026-06-09days on market $299,000 Active 10 DOM
-
2026-06-09price $299,000 Active 9 DOM
-
2026-06-08days on market $425,000 Active 9 DOM
-
2026-06-07days on market $425,000 Active 8 DOM
-
2026-06-03days on market $425,000 Active 4 DOM
-
2026-06-02days on market $425,000 Active 3 DOM
-
2026-06-01days on market $425,000 Active 2 DOM
-
2026-05-31statusdays on market $425,000 Active 1 DOM
-
2026-05-30days on market $425,000 Coming Soon 3 DOM
-
2026-05-27historical $425,000
-
2022-07-08soldstatus $300,000
-
2005-04-05soldstatus $220,000
-
2005-04-01soldstatus $220,000 76-char remark
Show marketing remark (76 chars)
Features a large great room off of kitchen. Great neighborhood for children!
-
2005-02-11price $229,000 76-char remark
Show marketing remark (76 chars)
Features a large great room off of kitchen. Great neighborhood for children!
-
2005-02-11historical 76-char remark
Show marketing remark (76 chars)
Features a large great room off of kitchen. Great neighborhood for children!
-
2004-08-11$220,000 76-char remark
Show marketing remark (76 chars)
Features a large great room off of kitchen. Great neighborhood for children!
ⓘ Source: listings_history table (triggers on properties + properties_extension) + one-shot
backfill from property_details.listing_events for pre-trigger history.
Tax reassessment forecast NY · Partial reset (capped growth)
- Current annual tax
- $5,645 · $470/mo
- Projected year-2 tax
- $5,645 · $470/mo
- Expected delta
- $0/yr ($0/mo · 0.0%)
ⓘ Screening estimate from a state-policy table — verify with the county assessor before closing.
Climate risk First Street
- Flood 1/10 Low FEMA zone X (unshaded) · 0% chance over 30 yrs
- Wildfire 3/10 Moderate
- Heat 4/10 Moderate 7 d/yr ≥98°F today · 16 d/yr by 30 yrs out
- Wind 4/10 Moderate 14% chance of damaging wind over 30 yrs
- Air quality 2/10 Low 1 unhealthy d/yr today · 2 by 30 yrs out
Nearby sold comps map
Loading sold comps map…
Walkable amenities ~0.75 mi
Loading nearby amenities…
Taxation est. · year 1
- Rental income
- $34,297
- − Mortgage interest
- −$16,749
- − Property taxes
- −$5,645
- − Insurance
- −$1,495
- − Repairs & maintenance
- −$2,744
- − Management
- −$2,744
- − Depreciation
- −$8,698
- Taxable loss
- −$3,778
- Est. tax savings @ 24.0%
- +$907
- After-tax cash flow
- $2,045/yr
For passive investors: Depreciation is non-cash, so a rental often shows a tax loss while cash-flowing — sheltering income. Rental losses are passive: they offset passive income freely, and up to $25,000/yr can offset ordinary (W-2) income if you actively participate and your MAGI is under $100k (phasing out to $0 by $150k); unused losses carry forward. On sale, claimed depreciation is recaptured at up to 25%, and gains may owe capital-gains tax (a 1031 exchange can defer both). Figures are a year-1 estimate at your 24.0% rate — not tax advice; consult a CPA.
Schools (NCES district)
- District
- Newburgh City School District
- NCES district ID
- 3620700
- Math proficiency
- 33% ▼ -8.00%
- Reading proficiency
- 48% ▲ 10.00%
- Median HH income
- $56,387
- Composite
- 35.46/100
- National rank
- #4927
- State rank
- #500 of 590 in NY
Livability — Orange Lake
- Score
- 60/100
- State rank
- #972
- US rank
- #18993
Category grades
Schools grade is shown separately in the Schools card above.
Census & demographics
- County
- Orange County · 267,004 people
- City population
- 27,384
- Metro
- Poughkeepsie-Newburgh-Middletown, NY
- Population (ZIP)
- 27,384
- Household income
- $92,757
- Rent vs Own
- Severe rent burden
- 960.0
Population outlook (Orange County) Hauer SSP2
- Today (2025)
- 379,830 people
- By 2030
- 378,955 · -0.2%
- By 2040
- 375,444 · -1.2%
- By 2050
- 369,311 · -2.8%
- By 2075
- 354,233 · -6.7%
- By 2100
- 318,150 · -16.2%
Race, ethnicity, and origin ACS 2023
- Neighborhood character
- Diverse neighborhood (Simpson 0.62)
- Race & ethnicity
- White 53% Hispanic / Latino 27% Black 13% Two or more races 9% Asian 5%
- Hispanic origin (detail)
- Mexican 3% Puerto Rican 14% Dominican 5%
- Common ancestry
- Romanian 3% Slovak 2% Portuguese 1%
- Foreign-born
- 14% · Canada, China, Vietnam
- Languages at home
- 76% English-only · Spanish 16% Other Indo-European 2% Chinese 1%
Political lean MEDSL · Orange
- 2024 margin
- Lean R (+8.4) · D 45.8% · R 54.2%
- 2008→2024 swing
- -12.5pp toward R · 2008: 4.1pp · 2024: -8.4pp
- All cycles
- 2024: R+8.4 2020: R+0.2 2016: R+6.5 2012: D+5.2 2008: D+4.1
Not yet ingested
- Civics
- —
Market trends
- HPI YoY
- ▼ -145.96%
- Current HPI
- 314.8506
- Rent YoY
- —
- Metro
- Poughkeepsie-Newburgh-Middletown, NY
- State GDP YoY
- ▲ 2.60%
- F500 in state
- 92
Industry mix (Fortune 500 HQ in NY)
| Industry | F500 HQs | Revenue |
|---|---|---|
| Financial Services | 10 | $950B |
|
||
| Consumer Goods | 9 | $162B |
|
||
| Insurance | 4 | $225B |
|
||
| Telecommunications | 2 | $144B |
|
||
| Pharmaceuticals | 2 | $112B |
|
||
| Media / Entertainment | 2 | $69B |
|
||
Price history
+93.2% since first listed7 events — show timeline
- 2026-05-27 Coming Soon $425,000 OneKey® MLS as Distributed by MLS Grid
- 2022-07-08 Sold (Public Records) $300,000 Public Records
- 2005-04-05 Sold (Public Records) $220,000 Public Records
- 2005-04-01 Sold (MLS) $220,000 HGMLS
- 2005-02-11 Delisted — HGMLS
- 2005-02-11 Price Changed $229,000 HGMLS
- 2004-08-11 Listed $220,000 HGMLS
Property tax history
+1.0%/yrLatest (2025): $5,645 · -2.3% YoY. Source: county tax records.
Cash-flow waterfall
monthlySold comps — $/sqft
last 12 mo · ≤1 miLoading sold comps…