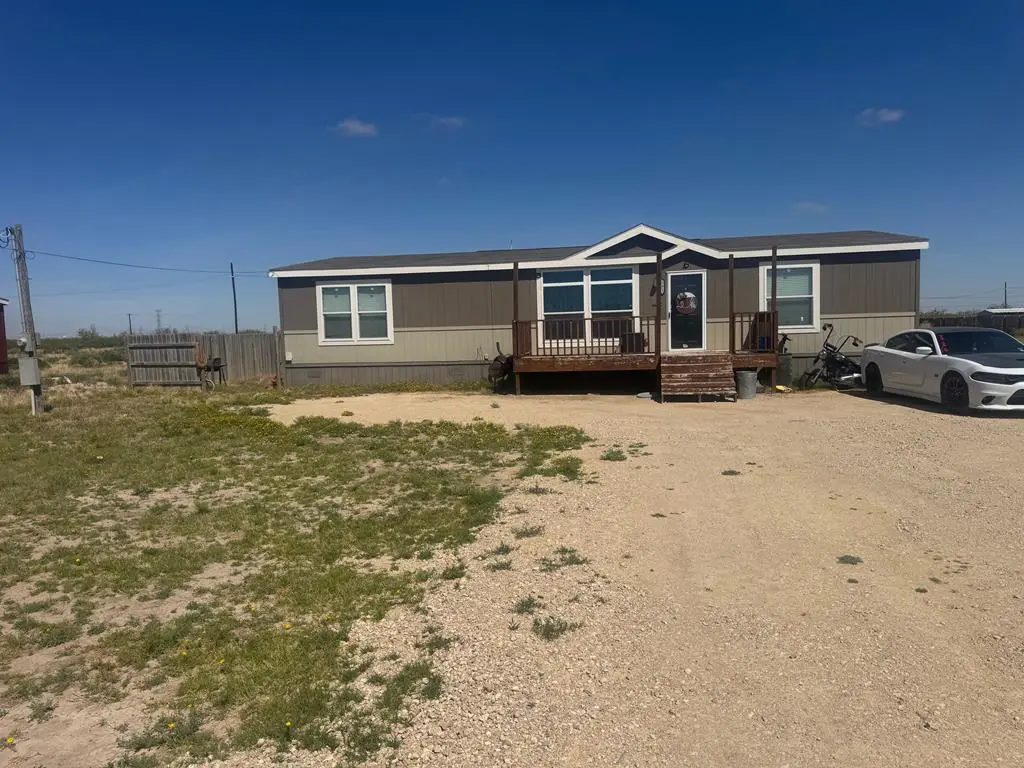
13912 W County Rd 171
Odessa, TX 79766
$225,000C+
3 bd · 2.0 ba ·
1,792 sqft ·
Built 2019
· Manufactured
· Active
· 67 DOM
Cashflow @ list (25.0% down · 7.5%)
Estimated rent
$2,276/mo
Mortgage (P&I)
−$1,180
Tax + insurance
−$269
HOA
−$0
Vac / Maint / Mgmt
−$478
Net cashflow
$349/mo
Annual
$4,192/yr
Cap rate
8.51%
Cash-on-cash
7.92%
DSCR
1.35
1% rule
1.01%
Cash to close
$63,000
Investor read
- This is a 3-bed/2.0-bath manufactured listed at $225k.
- At list price, monthly cash flow is $349 ($4k/yr) — positive.
- The deal already cash-flows at list — no discount required.
- Meets the 1% rule at list price ($2k rent vs $225k).
- It's been on market 67 days — a 6% lower offer ($212k) is reasonable based on typical stale-listing flexibility.
- Recommended offer: $212k (6.0% below list) — sets the bar for market timing.
- In year one you build about $13k of equity ($2k loan paydown + $11k appreciation (4.9% local appreciation)).
- Location reads 75/100 on livability (#132 in TX, #3,928 nationally) — a middle-class / working-renter tenant base. Strengths: cost of living A+, housing A+, health & safety A+; Watch: commute D+, amenities D.
- Midland ISD (urban): math 34% / reading 36% proficiency, ranked #477 of 826 in TX (top 58%) — families likely to look elsewhere, expect single-tenant / working-renter base with shorter leases.
- Zoned schools: Ralph Bunche El (math 22% / reading 17%, grade F, #3,583 of 4,322 statewide, top 86%, 974 students, 88% FRL, charter); Goddard J H (math 23% / reading 32%, grade F, #1,156 of 1,662 statewide, top 71%, 1,024 students, 58% FRL, charter); Midland H S (math 37% / reading 7%, grade F, #1,366 of 1,632 statewide, top 84%, 2,492 students, 44% FRL).
- Zoned-school proficiency averages 23% at this address vs 35% district-wide (-12 pts) — the specific schools serving this property underperform the Midland ISD average; the district grade overstates school quality for this exact location.
- Watch-outs: flood insurance adds $66/mo.
- Market conditions: 78 active listings in the ZIP; 1,504 units permitted in Midland County in 2024 (0 in 5+ unit buildings).
- Midland County population projected at +83% by 2050 — long-run rental-demand tailwind backs the buy-and-hold thesis.
- At projected returns (4.9% appreciation + 3.0% rent growth), your $63k cash investment doubles in ~4 years — after that, you're playing with house money.
- By year 3, paydown + projected appreciation supports a ~$31k cash-out refi (75% LTV) — recoverable capital for the next deal without selling this one.
- Climate carrying-cost: major flood risk; major wildfire risk; extreme-heat days projected 7→22/yr by 2055 (HVAC capex compounding) — expect insurance premiums to compound above CPI over the hold.
Questions for listing agent
- It's been on market 67 days. Have you received any prior offers? Is the seller open to a 6% concession, seller financing, or rate buy-down credit?
- What's the actual annual flood-insurance premium (NFIP or private), and is the property in a SFHA with mandatory coverage?
- Why hasn't it sold? Are there any deal-killer items the seller is aware of (foundation, flood, title, zoning, code violations)?
- Is there a deadline driving the sale (1031 exchange, divorce, estate, relocation)? That informs how much negotiation room exists.
- Schools are F-rated, which usually means shorter tenancies and higher turnover. Who's the typical renter profile here, and what's been the actual vacancy rate?
- What's the average days-on-market for RENTAL listings here right now (not sales)? A rising rental-DOM trend means longer vacancies and softer asking-rent achievability than the comps imply.
- What's the recent tenant-quality profile in this submarket — average credit score on applications, eviction rate, late-payment / NSF rate, and stable-employment percentage? A property-management company in the area should have these aggregated.
- How much new for-sale + rental construction is in the pipeline within 1–3 miles? Heavy new supply typically softens prices + rents 12–24 months out; constrained supply supports both.
CashFlowRE · CFR-5B7TY96JSVBE3K
· Data 4 days ago
cashflowre.app · 2026-05-29