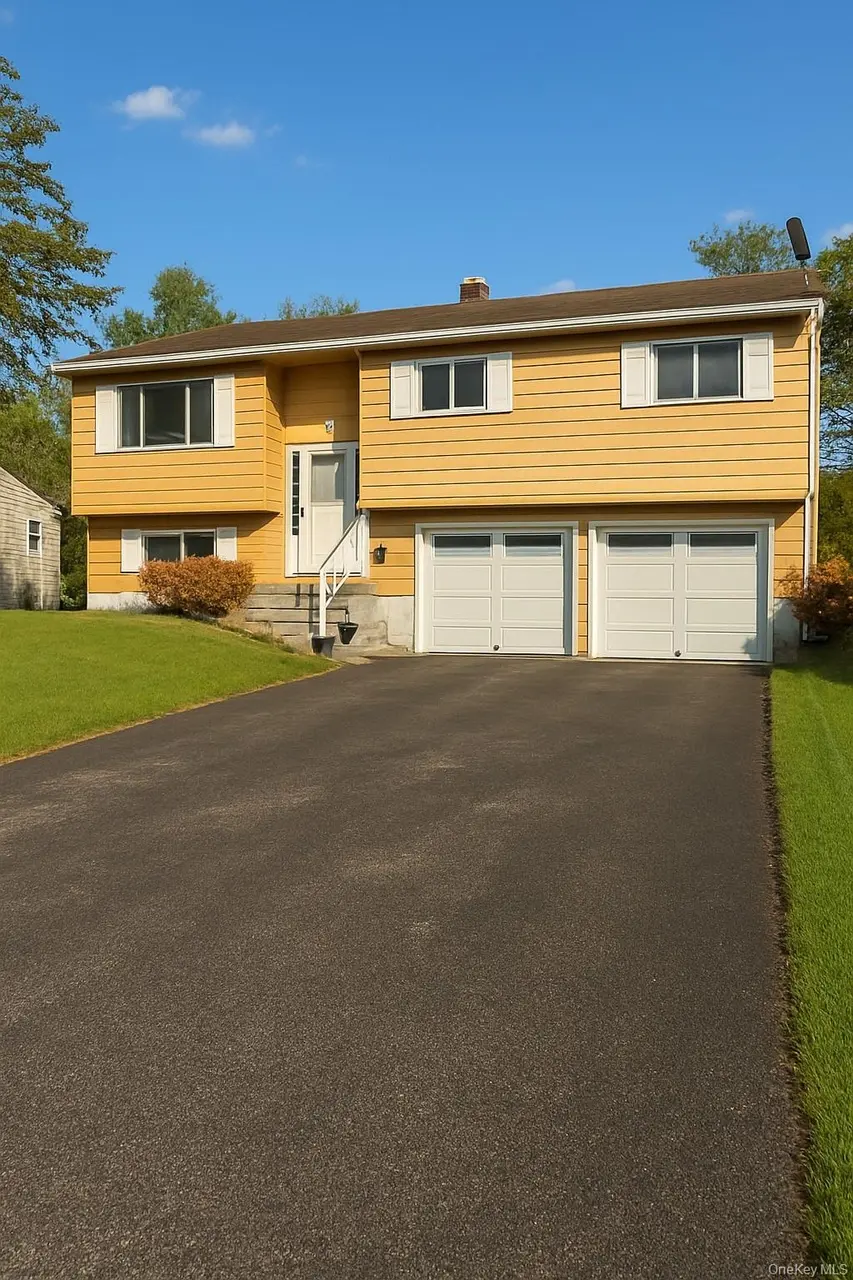
5 Cayuga Dr
Myers Corner, NY 12590
$374,999D
4 bd · 1.0 ba ·
1,660 sqft ·
Built 1962
· SingleFamily
· Pending
· 19 DOM
Cashflow @ list (25.0% down · 7.5%)
Estimated rent
$3,065/mo
Mortgage (P&I)
−$1,967
Tax + insurance
−$826
HOA
−$0
Vac / Maint / Mgmt
−$644
Net cashflow
$-372/mo
Annual
$-4,462/yr
Cap rate
5.10%
Cash-on-cash
-4.25%
DSCR
0.81
1% rule
0.82%
Cash to close
$105,000
Investor read
- This is a 4-bed/1.0-bath single-family listed at $375k.
- At list price, monthly cash flow is $-372 ($-4k/yr) — negative.
- To cash-flow at today's rent, offer at most $309k (17.5% below list).
- To meet the 1% rule (rent ≥ 1% of price), the offer needs to be $306k (18.3% below list).
- It's been on market 19 days — a 2% lower offer ($369k) is reasonable based on typical stale-listing flexibility.
- Recommended offer: $306k (18.3% below list) — sets the bar for 1% rule.
- Local home prices are declining (-3.0%/yr); year-one equity from $3k of loan paydown is wiped out by about $11k of value loss. Plan a longer hold.
- Location reads 69/100 on livability (#511 in NY) — a middle-class / working-renter tenant base. Strengths: employment A+, housing A+, health & safety A; Watch: amenities F, commute F, cost of living D-.
- Wappingers Central School District (suburban): math 53% / reading 65% proficiency, ranked #207 of 590 in NY (top 35%) — acceptable for families but not a draw, mixed tenant base, ~2y average lease; only 15% free/reduced lunch — higher-income household profile.
- Zoned schools: Sheafe Road Elementary School (math 36% / reading 53%, grade F, #1,277 of 2,108 statewide, top 64%, 575 students, 38% FRL); Wappingers Junior High School (math 30% / reading 54%, grade D-, #379 of 729 statewide, top 54%, 735 students, 36% FRL); Roy C Ketcham Senior High School (math 90% / reading 92%, grade A+, #203 of 1,100 statewide, top 20%, 1,612 students, 31% FRL) — zoned schools average 35% FRL vs 15% district-wide (20 pts higher); higher-poverty schools than district average — tighter screening recommended.
- Market conditions: Rents soft (-1.1%/yr); 205 active listings in the ZIP; 2 comparable units currently listed for rent nearby; solid renter incomes; 620 units permitted in Dutchess County in 2024 (242 in 5+ unit buildings).
- Dutchess County population projected at -11% by 2050 — secular population decline; favor cash flow + early exit over multi-decade hold.
- 3 sale attempts since 9y ago with the ask held roughly flat each time — persistent listings suggest the price (not the market) is what's stuck; bring a comps-based counter.
- Current owner paid $218k; list at $375k implies a 72% gain — meaningful room to come down on a strong offer.
- Climate carrying-cost: extreme-heat days projected 7→15/yr by 2055 (HVAC capex compounding) — expect insurance premiums to compound above CPI over the hold.
- Cap rate 5.1% vs local median 2.9% in Myers Corner — top-decile yield for the area; either an underpriced asset or a hidden risk that comps aren't pricing in. Stress-test before assuming the spread holds.
- This rent runs 36% of the median local income ($102k/yr) — at the standard rent-burdened threshold; future hikes will face affordability resistance.
Questions for listing agent
- What do current leases actually rent for vs. the listed asking? Can we see a recent rent roll and the last 12 months of T-12 income?
- Built in 1962 — when were the roof, HVAC, electrical panel, plumbing, and water heater last replaced?
- Is there a deadline driving the sale (1031 exchange, divorce, estate, relocation)? That informs how much negotiation room exists.
- Schools are D-rated, which usually means shorter tenancies and higher turnover. Who's the typical renter profile here, and what's been the actual vacancy rate?
- The area grade is low — what's the realistic commute time and amenity access for the typical tenant pool here? Any planned neighborhood developments (good or bad) we should know about?
- What's the average days-on-market for RENTAL listings here right now (not sales)? A rising rental-DOM trend means longer vacancies and softer asking-rent achievability than the comps imply.
- What's the recent tenant-quality profile in this submarket — average credit score on applications, eviction rate, late-payment / NSF rate, and stable-employment percentage? A property-management company in the area should have these aggregated.
- How much new for-sale + rental construction is in the pipeline within 1–3 miles? Heavy new supply typically softens prices + rents 12–24 months out; constrained supply supports both.
CashFlowRE · CFR-5CT3WM0Z0MA28N
· Data 3 weeks ago
cashflowre.app · 2026-05-29