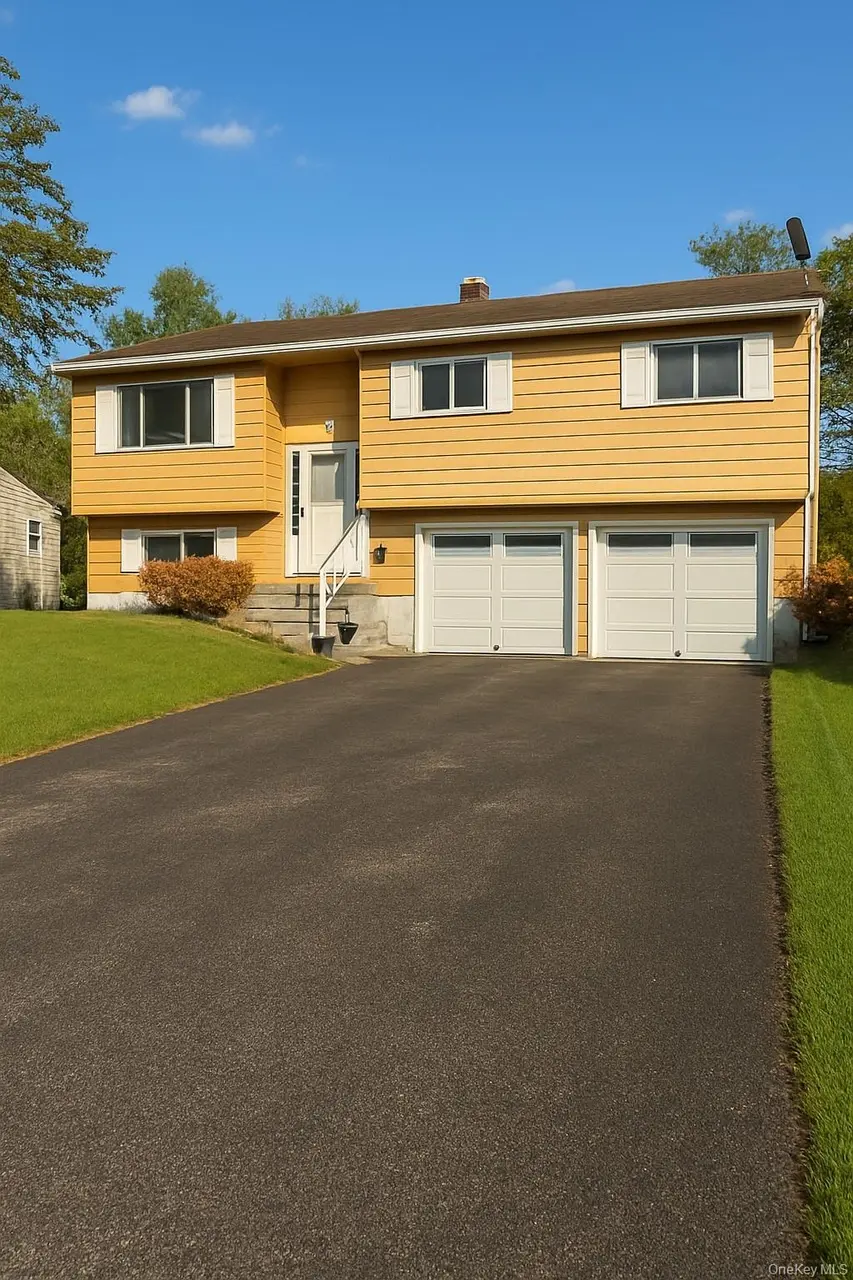
5 Cayuga Dr · Myers Corner, NY
Flood risk 3/10 · Minor
- FEMA flood zone
- X (unshaded)
- Chance of flooding over 30 yrs
- 0.1%
- Est. flood insurance / yr
- $473 – $860
Fire risk 3/10 · Minor
- Est. fire insurance / yr
- $691 – $1,283
Heat risk 5/10 · Moderate
- Hot days now (above 100°F)
- 7 days/yr
- Hot days in 30 yrs
- 15 days/yr
Wind risk 4/10 · Minor
- Chance of severe wind over 30 yrs
- 13.0%
Air-quality risk 3/10 · Minor
- Unhealthy air days now
- 2 days/yr
- Unhealthy air days in 30 yrs
- 3 days/yr
Risk factors via First Street. Map © Google.
Why this score? — see what drove the D grade
The composite is a weighted blend of 9 inputs, each scored 0–100. Each bar is that input's sub-score; the figure is the points it added to the 100-point composite (weight × sub-score).
- ARV discount +15.0/15.0
- Cash flow +8.1/30.0
- Schools +5.3/10.0
- Livability +3.5/5.0
- 1% rule +3.2/10.0
- Condition / age +2.5/5.0
- Rent growth +2.2/5.0
- DSCR +2.1/10.0
- Appreciation +0.0/10.0
$374,999
🖨 Deal sheet 📄 Offer letter ✓ Due diligence
Listing remarks MLS
WELL MAINTAINED FAMILY HOME IN WAPPINGER FALLS. FEATURES 4 LARGE BEDROOM WITH WALK IN CLOSETS. LG LIVING ROOM WITH FORMAL DINNING ROOM, PELLET STOVE. WALL TO WALL CARPET,EAT IN KITCHEN W TAXAS SALOON DOORS AND CERAMIC TILES, FULL FINISHED WALK OUT BASEMENT. MECHANICALS TOP OF THE LINE CONDITIONS. A MUST SEE HOME. MOTIVATED SELLER. AGENTS PLEASE SEE CONFIDENTIAL REMARKS ON SHOWING TIMES.,EQUIPMENT:Carbon Monoxide Detector,Smoke Detectors,Water Filter,Below Grnd Sq Feet:528,AMENITIES:Medical Facility,ROOF:Asphalt Shingles,Level 2 Desc:1 BEDROOM, FAMILY ONE,ExteriorFeatures:Landscaped,Outside Lighting,FLOORING:Ceramic Tile,InteriorFeatures:Walk-In Closets,Sliding Glass Doors,AboveGrade:1660,Level 1 Desc:LIVING ROOM, 3 BEDROOMS, KITCHEN, BATH DINNING ROOM,OTHERROOMS:Family Room
Key facts
- Large eat-in kitchen
- Formal dining room
- Gutters replaced
Tags
Property features AI
Exterior
- Parking: Covered parking; Driveway; Off-street parking; Private parking; Detached 2-car garage
- Utilities: Public sewer; Water available; Electricity available; Cable available; Trash collection (private); Electric service by Central Hudson
- Home design: Single family residence
- Construction: Wood siding; Finished full basement with walk-out access; Attic: none
- Exterior features: Back yard; Private lot; Near public transit; Near shops; Near school; No waterfront; Garage(s) on property
Interior
- Kitchen: Oven; Range; Refrigerator; Dryer
- Flooring: Hardwood floors; Tile floors
- Bathrooms: One full bathroom
- Heating & cooling: Baseboard heating; Hot water heating; Steam heating; Wall/window air conditioning units
- Interior features: Washer/dryer hookup; Dehumidifier; Deck
- Laundry & utility: Washer; Washer hookup in basement; Laundry in basement
Neighborhood map
What this means for you Summary
Snapshot
- This is a 4-bed/1.0-bath single-family listed at $375k.
Deal economics
- At list price, monthly cash flow is $-372 ($-4k/yr) — negative.
- To cash-flow at today's rent, offer at most $309k (17.5% below list).
- To meet the 1% rule (rent ≥ 1% of price), the offer needs to be $306k (18.3% below list).
- Recommended offer: $306k (18.3% below list) — sets the bar for 1% rule.
- Cap rate 5.1% vs local median 2.9% in Myers Corner — top-decile yield for the area; either an underpriced asset or a hidden risk that comps aren't pricing in. Stress-test before assuming the spread holds.
Location & tenants
- Location reads 69/100 on livability (#511 in NY) — a middle-class / working-renter tenant base. Strengths: employment A+, housing A+, health & safety A; Watch: amenities F, commute F, cost of living D-.
- Wappingers Central School District (suburban): math 53% / reading 65% proficiency, ranked #207 of 590 in NY (top 35%) — acceptable for families but not a draw, mixed tenant base, ~2y average lease; only 15% free/reduced lunch — higher-income household profile.
- Zoned schools: Sheafe Road Elementary School (math 36% / reading 53%, grade F, #1,277 of 2,108 statewide, top 64%, 575 students, 38% FRL); Wappingers Junior High School (math 30% / reading 54%, grade D-, #379 of 729 statewide, top 54%, 735 students, 36% FRL); Roy C Ketcham Senior High School (math 90% / reading 92%, grade A+, #203 of 1,100 statewide, top 20%, 1,612 students, 31% FRL) — zoned schools average 35% FRL vs 15% district-wide (20 pts higher); higher-poverty schools than district average — tighter screening recommended.
- Market conditions: Rents soft (-1.1%/yr); 205 active listings in the ZIP; 2 comparable units currently listed for rent nearby; solid renter incomes; 620 units permitted in Dutchess County in 2024 (242 in 5+ unit buildings).
- This rent runs 36% of the median local income ($102k/yr) — at the standard rent-burdened threshold; future hikes will face affordability resistance.
Forward outlook
- Local home prices are declining (-3.0%/yr); year-one equity from $3k of loan paydown is wiped out by about $11k of value loss. Plan a longer hold.
- Dutchess County population projected at -11% by 2050 — secular population decline; favor cash flow + early exit over multi-decade hold.
Negotiation context
- It's been on market 19 days — a 2% lower offer ($369k) is reasonable based on typical stale-listing flexibility.
- 3 sale attempts since 9y ago with the ask held roughly flat each time — persistent listings suggest the price (not the market) is what's stuck; bring a comps-based counter.
- Current owner paid $218k; list at $375k implies a 72% gain — meaningful room to come down on a strong offer.
Risks & watch-outs
- Climate carrying-cost: extreme-heat days projected 7→15/yr by 2055 (HVAC capex compounding) — expect insurance premiums to compound above CPI over the hold.
Questions for the listing agent
- What do current leases actually rent for vs. the listed asking? Can we see a recent rent roll and the last 12 months of T-12 income?
- Built in 1962 — when were the roof, HVAC, electrical panel, plumbing, and water heater last replaced?
- Is there a deadline driving the sale (1031 exchange, divorce, estate, relocation)? That informs how much negotiation room exists.
- Schools are D-rated, which usually means shorter tenancies and higher turnover. Who's the typical renter profile here, and what's been the actual vacancy rate?
- The area grade is low — what's the realistic commute time and amenity access for the typical tenant pool here? Any planned neighborhood developments (good or bad) we should know about?
- What's the average days-on-market for RENTAL listings here right now (not sales)? A rising rental-DOM trend means longer vacancies and softer asking-rent achievability than the comps imply.
- What's the recent tenant-quality profile in this submarket — average credit score on applications, eviction rate, late-payment / NSF rate, and stable-employment percentage? A property-management company in the area should have these aggregated.
- How much new for-sale + rental construction is in the pipeline within 1–3 miles? Heavy new supply typically softens prices + rents 12–24 months out; constrained supply supports both.
Investment metrics
- 1% rule
- 0.82% ✗
- Cap rate
- 5.10%
- Cash-on-cash
- -4.25%
- DSCR
- 0.81
- GRM
- 10.2
CMA / ARV
- ARV (median comp)
- $515,234
- List price
- $374,999
- Delta
- -27.22%
- Verdict
- UNDERPRICED
- Comps
- 20 within 1.0 mi
Show comp detail 6 sales within ~0.75 mi
| Address | Dist | Beds/Ba | Sqft | Sold | Price | $/sf | Match |
|---|---|---|---|---|---|---|---|
| 12 Seneca Ln | 0.10mi | 4/2.0 | 1,782 (+7%) | 23mo | $387,000 | $217 | 60 |
| 25 Mac Farlane Rd | 0.50mi | 3/2.0 (-1) | 1,702 (+2%) | 5mo | $440,000 | $259 | 59 |
| 9 Fowlerhouse Rd | 0.41mi | 3/1.0 (-1) | 1,848 (+11%) | 11mo | $410,000 | $222 | 48 |
| 32 Sucich Pl | 0.56mi | 3/1.5 (-1) | 1,612 (-3%) | 24mo | $410,000 | $254 | 42 |
| 14 Sucich Pl | 0.60mi | 3/2.0 (-1) | 1,716 (+3%) | 19mo | $400,010 | $233 | 41 |
| 16 Beechwood Cir | 0.30mi | 3/3.0 (-1) | 1,846 (+11%) | 23mo | $455,000 | $246 | 35 |
Match score weights: distance 35% · size 25% · config 20% · recency 20%. Top-matched comps best support the ARV.
Projected returns pro-forma
-3.0% appreciation · 0.0% rent growth · sell at horizon
- IRR
- -27.1%
- Equity multiple
- 0.11×
- Total profit
- $-93,257
- Equity at exit
- $55,914
- IRR
- -42.3%
- Equity multiple
- -0.39×
- Total profit
- $-145,719
- Equity at exit
- $32,423
Cash invested: $105,000 (down + closing). Projections, not guarantees.
Landlord ↔ Tenant lean methodology
- Overall (STATE)
- 15 Strongly Tenant-Friendly
- State New York
- 15 Strongly Tenant-Friendly · D+10
- County
- — inherits STATE
- City
- — inherits STATE
ZIP-level market 12590
- Rents YoY
- -1.1%
- Active inventory
- 205
- Price-to-rent
- 10.2×
Monthly cashflow live
- Estimated rent
- $3,065 medium interval (Pro) →
- Mortgage (P&I)
- −$1,967
- Tax from tax record
- −$670 /mo · $8,043/yr
- Insurance
- −$156
- HOA
- −$0
- Vacancy / Maint / Mgmt
- −$644
- Net cashflow
- $-372
Break-even live
UW: 25.0% down · 7.5% · 30yr · 1.5% tax · 5.0% vac · 8.0% maint · 8.0% mgmt
Financing live
Cash to close
- Down payment
- $93,750
- Closing costs
- $11,250
- Reserves months
- —
- Total cash needed
- —
Loan-product check · same deal, 3 products live
Conventional
25% down · 7.5% · 30yr
- Down + closing
- —
- Monthly P&I
- —
- Monthly cashflow
- —
- DSCR
- —
- Eligible?
- —
Personal DTI + credit; lowest rate.
DSCR
20% down · 8.5% · 30yr
- Down + closing
- —
- Monthly P&I
- —
- Monthly cashflow
- —
- DSCR
- —
- Eligible?
- —
No personal income docs; deal must DSCR.
Hard money
10% down · 12.0% · 12mo
- Down + closing
- —
- Monthly P&I
- —
- Monthly cashflow
- —
- DSCR
- —
- Eligible?
- —
Short-term bridge; refi at stabilization.
Rent comps 2 comps
| Address | Beds | Baths | Sqft | Rent | $/sqft | DOM | Units | Dist |
|---|---|---|---|---|---|---|---|---|
| 21 Franklindale Ave Unit 21 UPPER Wappingers Falls, NY | 3.0 | 1.0 | 1600 | $2,195 | $1.37 | 43d | 1 | 1.09mi |
| 5118 Princess Cir Unit Three Wappingers Falls, NY | 3.0 | 2.0 | 1300 | $2,850 | $2.19 | 23d | 1 | 1.14mi |
Listing history 10 events
-
2026-05-01$374,999 Active 1099-char remark
-
2026-01-31status Pending
-
2026-01-30historical
-
2026-01-13price $375,000
-
2025-11-24$394,998 Active
-
2025-11-22historical
-
2017-07-20soldstatus $217,500
-
2017-07-10soldstatus $217,500
Show marketing remark (784 chars)
WELL MAINTAINED FAMILY HOME IN WAPPINGER FALLS. FEATURES 4 LARGE BEDROOM WITH WALK IN CLOSETS. LG LIVING ROOM WITH FORMAL DINNING ROOM, PELLET STOVE. WALL TO WALL CARPET,EAT IN KITCHEN W TAXAS SALOON DOORS AND CERAMIC TILES, FULL FINISHED WALK OUT BASEMENT. MECHANICALS TOP OF THE LINE CONDITIONS. A MUST SEE HOME. MOTIVATED SELLER. AGENTS PLEASE SEE CONFIDENTIAL REMARKS ON SHOWING TIMES.,EQUIPMENT:Carbon Monoxide Detector,Smoke Detectors,Water Filter,Below Grnd Sq Feet:528,AMENITIES:Medical Facility,ROOF:Asphalt Shingles,Level 2 Desc:1 BEDROOM, FAMILY ONE,ExteriorFeatures:Landscaped,Outside Lighting,FLOORING:Ceramic Tile,InteriorFeatures:Walk-In Closets,Sliding Glass Doors,AboveGrade:1660,Level 1 Desc:LIVING ROOM, 3 BEDROOMS, KITCHEN, BATH DINNING ROOM,OTHERROOMS:Family Room
-
2017-03-04$235,000
Show marketing remark (784 chars)
WELL MAINTAINED FAMILY HOME IN WAPPINGER FALLS. FEATURES 4 LARGE BEDROOM WITH WALK IN CLOSETS. LG LIVING ROOM WITH FORMAL DINNING ROOM, PELLET STOVE. WALL TO WALL CARPET,EAT IN KITCHEN W TAXAS SALOON DOORS AND CERAMIC TILES, FULL FINISHED WALK OUT BASEMENT. MECHANICALS TOP OF THE LINE CONDITIONS. A MUST SEE HOME. MOTIVATED SELLER. AGENTS PLEASE SEE CONFIDENTIAL REMARKS ON SHOWING TIMES.,EQUIPMENT:Carbon Monoxide Detector,Smoke Detectors,Water Filter,Below Grnd Sq Feet:528,AMENITIES:Medical Facility,ROOF:Asphalt Shingles,Level 2 Desc:1 BEDROOM, FAMILY ONE,ExteriorFeatures:Landscaped,Outside Lighting,FLOORING:Ceramic Tile,InteriorFeatures:Walk-In Closets,Sliding Glass Doors,AboveGrade:1660,Level 1 Desc:LIVING ROOM, 3 BEDROOMS, KITCHEN, BATH DINNING ROOM,OTHERROOMS:Family Room
-
1990-06-25soldstatus $130,000
ⓘ Source: listings_history table (triggers on properties + properties_extension) + one-shot
backfill from property_details.listing_events for pre-trigger history.
Tax reassessment forecast NY · Partial reset (capped growth)
- Current annual tax
- $8,043 · $670/mo
- Projected year-2 tax
- $8,043 · $670/mo
- Expected delta
- $0/yr ($0/mo · 0.0%)
ⓘ Screening estimate from a state-policy table — verify with the county assessor before closing.
Climate risk First Street
- Flood 3/10 Moderate FEMA zone X (unshaded) · 10% chance over 30 yrs
- Wildfire 3/10 Moderate
- Heat 5/10 Major 7 d/yr ≥100°F today · 15 d/yr by 30 yrs out
- Wind 4/10 Moderate 13% chance of damaging wind over 30 yrs
- Air quality 3/10 Moderate 2 unhealthy d/yr today · 3 by 30 yrs out
Nearby sold comps map
Loading sold comps map…
Walkable amenities ~0.75 mi
Loading nearby amenities…
Taxation est. · year 1
- Rental income
- $36,778
- − Mortgage interest
- −$21,006
- − Property taxes
- −$8,043
- − Insurance
- −$1,875
- − Repairs & maintenance
- −$2,942
- − Management
- −$2,942
- − Depreciation
- −$10,909
- Taxable loss
- −$10,939
- Est. tax savings @ 24.0%
- +$2,625
- After-tax cash flow
- $-1,836/yr
For passive investors: Depreciation is non-cash, so a rental often shows a tax loss while cash-flowing — sheltering income. Rental losses are passive: they offset passive income freely, and up to $25,000/yr can offset ordinary (W-2) income if you actively participate and your MAGI is under $100k (phasing out to $0 by $150k); unused losses carry forward. On sale, claimed depreciation is recaptured at up to 25%, and gains may owe capital-gains tax (a 1031 exchange can defer both). Figures are a year-1 estimate at your 24.0% rate — not tax advice; consult a CPA.
Schools (NCES district)
- District
- Wappingers Central School District
- NCES district ID
- 3629880
- Math proficiency
- 53% ▼ -4.00%
- Reading proficiency
- 65% ▲ 10.00%
- Median HH income
- $83,184
- Composite
- 53.38/100
- National rank
- #1474
- State rank
- #207 of 590 in NY
Livability — Myers Corner
- Score
- 69/100
- State rank
- #511
- US rank
- #9062
Category grades
Schools grade is shown separately in the Schools card above.
Census & demographics
- County
- Dutchess County · 188,048 people
- City population
- 35,823
- Metro
- Poughkeepsie-Newburgh-Middletown, NY
- Population (ZIP)
- 35,712
- Household income
- $102,285
- Rent vs Own
- Severe rent burden
- 786.0
Population outlook (Dutchess County) Hauer SSP2
- Today (2025)
- 291,768 people
- By 2030
- 287,131 · -1.6%
- By 2040
- 274,881 · -5.8%
- By 2050
- 259,971 · -10.9%
- By 2075
- 235,366 · -19.3%
- By 2100
- 208,786 · -28.4%
Race, ethnicity, and origin ACS 2023
- Neighborhood character
- Predominantly White (66%)
- Race & ethnicity
- White 66% Hispanic / Latino 18% Two or more races 8% Black 8% Asian 4%
- Hispanic origin (detail)
- Mexican 3% Puerto Rican 7% Dominican 1%
- Common ancestry
- Romanian 3% Italian 1% Lithuanian 1%
- Foreign-born
- 12% · Canada, Jamaica, China
- Languages at home
- 81% English-only · Spanish 12% Other Indo-European 3% Chinese 1%
Political lean MEDSL · Dutchess
- 2024 margin
- Lean D (+5.4) · D 52.7% · R 47.3%
- 2008→2024 swing
- -3.2pp toward R · 2008: 8.6pp · 2024: 5.4pp
- All cycles
- 2024: D+5.4 2020: D+9.6 2016: R+1.1 2012: D+6.6 2008: D+8.6
Not yet ingested
- Civics
- —
Market trends
- HPI YoY
- ▼ -411.49%
- Current HPI
- 255.2764
- Rent YoY
- ▼ -1.08%
- Metro
- Poughkeepsie-Newburgh-Middletown, NY
- State GDP YoY
- ▲ 2.60%
- F500 in state
- 92
Industry mix (Fortune 500 HQ in NY)
| Industry | F500 HQs | Revenue |
|---|---|---|
| Financial Services | 10 | $950B |
|
||
| Consumer Goods | 9 | $162B |
|
||
| Insurance | 4 | $225B |
|
||
| Telecommunications | 2 | $144B |
|
||
| Pharmaceuticals | 2 | $112B |
|
||
| Media / Entertainment | 2 | $69B |
|
||
Price history
+188.5% since first listed11 events — show timeline
- 2026-05-21 Pending — OneKey® MLS as Distributed by MLS Grid
- 2026-05-01 Listed $374,999 OneKey® MLS as Distributed by MLS Grid
- 2026-01-31 Pending — OneKey® MLS as Distributed by MLS Grid
- 2026-01-30 Listing Removed — OneKey® MLS as Distributed by MLS Grid
- 2026-01-13 Price Changed $375,000 OneKey® MLS as Distributed by MLS Grid
- 2025-11-24 Listed $394,998 OneKey® MLS as Distributed by MLS Grid
- 2025-11-22 Coming Soon — OneKey® MLS as Distributed by MLS Grid
- 2017-07-20 Sold (Public Records) $217,500 Public Records
- 2017-07-10 Sold (MLS) $217,500 OneKey® MLS as Distributed by MLS Grid
- 2017-03-04 Listed $235,000 OneKey® MLS as Distributed by MLS Grid
- 1990-06-25 Sold (Public Records) $130,000 Public Records
Property tax history
+5.2%/yrLatest (2025): $8,043 · +2.1% YoY. Source: county tax records.
Cash-flow waterfall
monthlySold comps — $/sqft
last 12 mo · ≤1 miLoading sold comps…