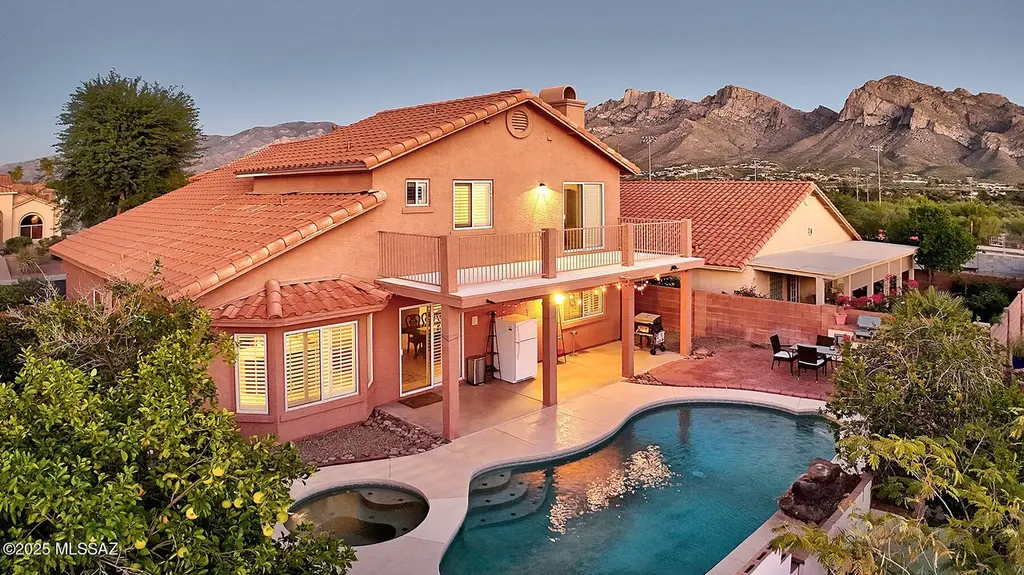
10527 N Camino Rosas Nuevas
Oro Valley, AZ 85737
$500,000C
5 bd · 4.0 ba ·
2,785 sqft ·
Built 1994
· SingleFamily
· Active
· 223 DOM
Cashflow @ list (25.0% down · 7.5%)
Estimated rent
$5,278/mo
Mortgage (P&I)
−$2,622
Tax + insurance
−$500
HOA
−$36
Vac / Maint / Mgmt
−$1,108
Net cashflow
$1,012/mo
Annual
$12,140/yr
Cap rate
8.72%
Cash-on-cash
8.67%
DSCR
1.39
1% rule
1.06%
Cash to close
$140,000
Investor read
- This is a 5-bed/4.0-bath single-family listed at $500k.
- At list price, monthly cash flow is $1k ($12k/yr) — positive.
- The deal already cash-flows at list — no discount required.
- Meets the 1% rule at list price ($5k rent vs $500k).
- It's been on market 223 days — a 12% lower offer ($440k) is reasonable based on typical stale-listing flexibility.
- Recommended offer: $440k (12.0% below list) — sets the bar for market timing.
- Local home prices are declining (-3.0%/yr); year-one equity from $3k of loan paydown is wiped out by about $15k of value loss. Plan a longer hold.
- Location reads 81/100 on livability (#2 in AZ, #1,339 nationally) — a professional / high-income tenant draw. Strengths: crime A+, employment A+, housing A+; Watch: commute D, amenities F, cost of living D-.
- Amphitheater Unified District (4406) (suburban): math 32% / reading 40% proficiency, ranked #85 of 249 in AZ (top 34%) — families likely to look elsewhere, expect single-tenant / working-renter base with shorter leases.
- Market conditions: Rents rising (+2.7%/yr); 163 active listings in the ZIP; 2 comparable units currently listed for rent nearby; solid renter incomes; 5,268 units permitted in Pima County in 2024 (996 in 5+ unit buildings).
- Pima County population projected at +8% by 2050 — modest demand growth; plan on rents tracking national, not racing it.
- 16 sale attempts since 24y ago; this cycle's ask has dropped $88k (15%) from the opening price — seller is motivated, your offer sets the floor, not the list.
- Climate carrying-cost: moderate wildfire risk; extreme-heat days projected 7→20/yr by 2055 (HVAC capex compounding) — expect insurance premiums to compound above CPI over the hold.
- Cap rate 8.7% vs local median 3.2% in Oro Valley — top-decile yield for the area; either an underpriced asset or a hidden risk that comps aren't pricing in. Stress-test before assuming the spread holds.
- At $5,278/mo this rent would consume 59% of the median local household income ($107k/yr) (locally 666% of renters already pay >50% of income on rent) — very limited rent-growth headroom before tenants either downsize or default.
Questions for listing agent
- It's been on market 223 days. Have you received any prior offers? Is the seller open to a 12% concession, seller financing, or rate buy-down credit?
- What does the HOA fee cover, when was the last increase, and are there any pending special assessments or reserve-fund shortfalls?
- Why hasn't it sold? Are there any deal-killer items the seller is aware of (foundation, flood, title, zoning, code violations)?
- Is there a deadline driving the sale (1031 exchange, divorce, estate, relocation)? That informs how much negotiation room exists.
- Schools are A-rated — typically a magnet for longer-tenancy family renters. What's the average tenant stay here, and is there a school-zone premium baked into asking?
- What's the average days-on-market for RENTAL listings here right now (not sales)? A rising rental-DOM trend means longer vacancies and softer asking-rent achievability than the comps imply.
- What's the recent tenant-quality profile in this submarket — average credit score on applications, eviction rate, late-payment / NSF rate, and stable-employment percentage? A property-management company in the area should have these aggregated.
- How much new for-sale + rental construction is in the pipeline within 1–3 miles? Heavy new supply typically softens prices + rents 12–24 months out; constrained supply supports both.
CashFlowRE · CFR-5D8SAPFT22H8P3
· Data 2 days ago
cashflowre.app · 2026-05-29