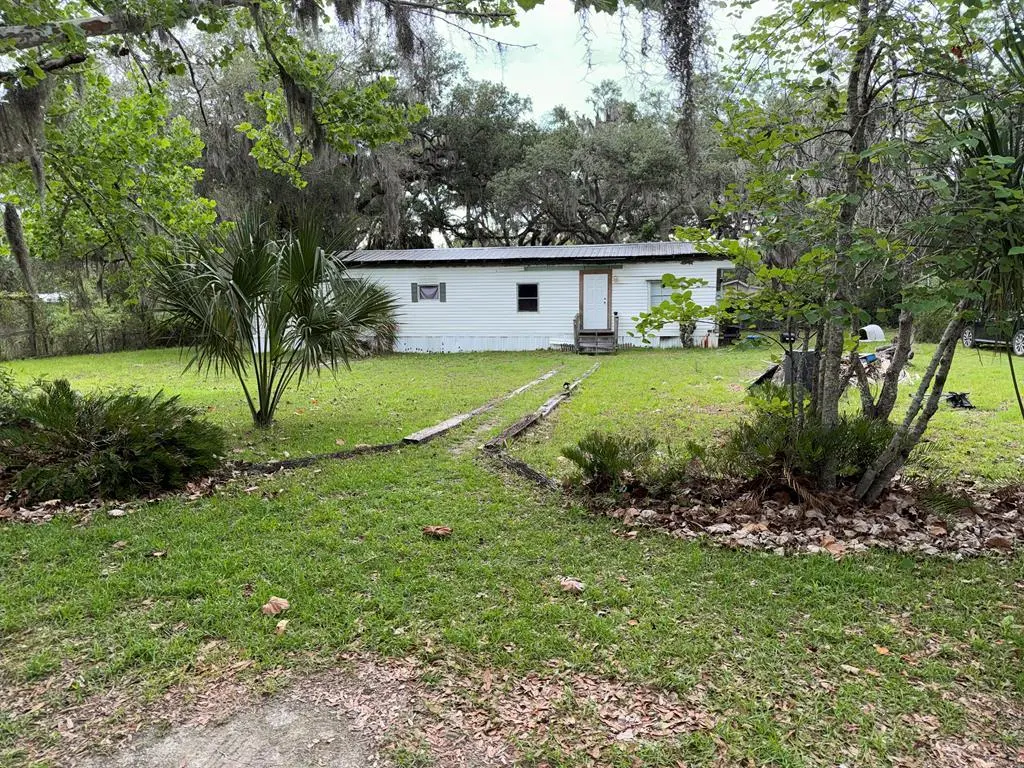
219 SE 70th Ave
Cross City, FL 32628
$99,900C
2 bd · 1.0 ba ·
672 sqft ·
Built 1975
· Manufactured
· Pending
· 8 DOM
Cashflow @ list (25.0% down · 7.5%)
Estimated rent
$940/mo
Mortgage (P&I)
−$524
Tax + insurance
−$113
HOA
−$0
Vac / Maint / Mgmt
−$197
Net cashflow
$105/mo
Annual
$1,263/yr
Cap rate
7.56%
Cash-on-cash
4.52%
DSCR
1.20
1% rule
0.94%
Cash to close
$27,972
Investor read
- This is a 2-bed/1.0-bath manufactured listed at $100k.
- At list price, monthly cash flow is $105 ($1k/yr) — positive.
- The deal already cash-flows at list — no discount required.
- To meet the 1% rule (rent ≥ 1% of price), the offer needs to be $94k (5.9% below list).
- Only 8 days on market — expect competitive offers; lowballing is unlikely to land.
- Recommended offer: $94k (5.9% below list) — sets the bar for 1% rule.
- In year one you build about $5k of equity ($691 loan paydown + $4k appreciation (4.2% local appreciation)).
- Location reads 70/100 on livability (#412 in FL) — a middle-class / working-renter tenant base. Strengths: cost of living A+, housing A+, health & safety A+; Watch: amenities F, commute F, employment F.
- Dixie (rural): math 52% / reading 50% proficiency, ranked #36 of 73 in FL (top 49%) — acceptable for families but not a draw, mixed tenant base, ~2y average lease; 85% free/reduced lunch — lower-income household profile, screen leases tightly.
- Market conditions: 47 active listings in the ZIP; 49 units permitted in Dixie County in 2024 (0 in 5+ unit buildings).
- Dixie County population projected at -16% by 2050 — secular population decline; favor cash flow + early exit over multi-decade hold.
- At projected returns (4.2% appreciation + 3.0% rent growth), your $28k cash investment doubles in ~5 years — after that, you're playing with house money.
- By year 7, paydown + projected appreciation supports a ~$31k cash-out refi (75% LTV) — recoverable capital for the next deal without selling this one.
- Climate carrying-cost: severe wind risk, 99% chance of damaging wind over 30y; major wildfire risk; extreme-heat days projected 7→22/yr by 2055 (HVAC capex compounding) — expect insurance premiums to compound above CPI over the hold.
- Cap rate 7.6% vs local median 4.1% in Cross City — top-decile yield for the area; either an underpriced asset or a hidden risk that comps aren't pricing in. Stress-test before assuming the spread holds.
Questions for listing agent
- Built in 1975 — when were the roof, HVAC, electrical panel, plumbing, and water heater last replaced?
- Is there a deadline driving the sale (1031 exchange, divorce, estate, relocation)? That informs how much negotiation room exists.
- What's the average days-on-market for RENTAL listings here right now (not sales)? A rising rental-DOM trend means longer vacancies and softer asking-rent achievability than the comps imply.
- What's the recent tenant-quality profile in this submarket — average credit score on applications, eviction rate, late-payment / NSF rate, and stable-employment percentage? A property-management company in the area should have these aggregated.
- How much new for-sale + rental construction is in the pipeline within 1–3 miles? Heavy new supply typically softens prices + rents 12–24 months out; constrained supply supports both.
CashFlowRE · CFR-5EASQN4777Y6V3
· Data 2 weeks ago
cashflowre.app · 2026-05-29