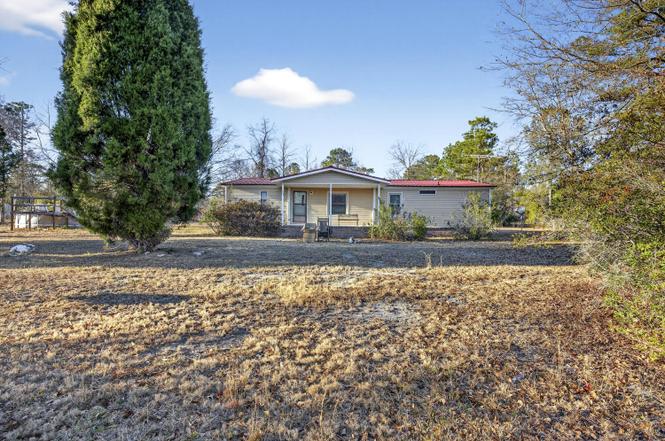
333 Grape Arbor Dr
Goose Creek, SC 29486
$210,000C
3 bd · 2.0 ba ·
1,300 sqft ·
Built 1988
· Manufactured
· Pending
· 14 DOM
Cashflow @ list (25.0% down · 7.5%)
Estimated rent
$2,324/mo
Mortgage (P&I)
−$1,101
Tax + insurance
−$350
HOA
−$0
Vac / Maint / Mgmt
−$488
Net cashflow
$384/mo
Annual
$4,613/yr
Cap rate
8.49%
Cash-on-cash
7.85%
DSCR
1.35
1% rule
1.11%
Cash to close
$58,800
Investor read
- This is a 3-bed/2.0-bath manufactured listed at $210k.
- At list price, monthly cash flow is $384 ($5k/yr) — positive.
- The deal already cash-flows at list — no discount required.
- Meets the 1% rule at list price ($2k rent vs $210k).
- Only 14 days on market — expect competitive offers; lowballing is unlikely to land.
- Local home prices are declining (-3.0%/yr); year-one equity from $1k of loan paydown is wiped out by about $6k of value loss. Plan a longer hold.
- Location reads 67/100 on livability (#103 in SC) — a middle-class / working-renter tenant base. Strengths: housing A+, employment A, cost of living B+; Watch: amenities F, commute F, health & safety F.
- Berkeley 01 (suburban): math 35% / reading 48% proficiency, ranked #30 of 80 in SC (top 38%) — families likely to look elsewhere, expect single-tenant / working-renter base with shorter leases.
- Zoned schools: Cane Bay Elementary (math 57% / reading 55%, grade C+, #109 of 597 statewide, top 19%, 1,263 students, 28% FRL); Cane Bay Middle (math 29% / reading 47%, grade F, #86 of 229 statewide, top 39%, 1,487 students, 30% FRL); Cane Bay High (math 50% / reading 84%, grade B, #73 of 196 statewide, top 41%, 2,158 students, 28% FRL) — zoned schools average 29% FRL vs 48% district-wide (20 pts lower); this property's tenant base skews higher-income than the district average.
- Zoned-school proficiency averages 54% at this address vs 42% district-wide (+12 pts) — the actual schools serving this property are materially stronger than the Berkeley 01 average implies; a family-tenant draw the district grade alone would hide.
- Market conditions: Rents rising (+2.7%/yr); 1301 active listings in the ZIP; 8 comparable units currently listed for rent nearby; rentals at typical pace (median 16d on market — plan ~3-4 weeks tenant-placement turnaround); solid renter incomes; 3,183 units permitted in Berkeley County in 2024 (580 in 5+ unit buildings).
- Berkeley County population projected at +48% by 2050 — long-run rental-demand tailwind backs the buy-and-hold thesis.
- Current owner paid $16k; list at $210k implies a 1221% gain — meaningful room to come down on a strong offer.
- Climate carrying-cost: severe wind risk, 98% chance of damaging wind over 30y; moderate wildfire risk; extreme-heat days projected 7→17/yr by 2055 (HVAC capex compounding) — expect insurance premiums to compound above CPI over the hold.
- Cap rate 8.5% vs local median 4.0% in Goose Creek — top-decile yield for the area; either an underpriced asset or a hidden risk that comps aren't pricing in. Stress-test before assuming the spread holds.
- This rent runs 31% of the median local income ($90k/yr) — at the standard rent-burdened threshold; future hikes will face affordability resistance.
Questions for listing agent
- Is there a deadline driving the sale (1031 exchange, divorce, estate, relocation)? That informs how much negotiation room exists.
- What's the average days-on-market for RENTAL listings here right now (not sales)? A rising rental-DOM trend means longer vacancies and softer asking-rent achievability than the comps imply.
- What's the recent tenant-quality profile in this submarket — average credit score on applications, eviction rate, late-payment / NSF rate, and stable-employment percentage? A property-management company in the area should have these aggregated.
- How much new for-sale + rental construction is in the pipeline within 1–3 miles? Heavy new supply typically softens prices + rents 12–24 months out; constrained supply supports both.
CashFlowRE · CFR-5EV1Q94Y5H7JWF
· Data 4 weeks ago
cashflowre.app · 2026-05-29