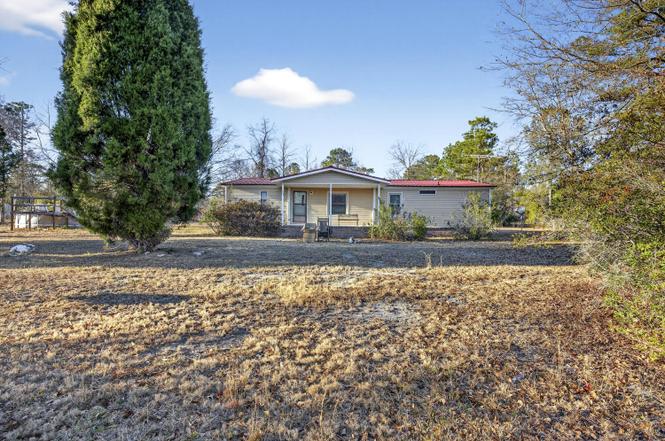
333 Grape Arbor Dr · Goose Creek, SC
Flood risk 1/10 · Minimal
- FEMA flood zone
- X (unshaded)
- Chance of flooding over 30 yrs
- 0.0%
- Est. flood insurance / yr
- $507 – $1,088
Fire risk 5/10 · Moderate
- Est. fire insurance / yr
- $783 – $1,453
Heat risk 9/10 · Severe
- Hot days now (above 107°F)
- 7 days/yr
- Hot days in 30 yrs
- 17 days/yr
Wind risk 8/10 · Major
- Chance of severe wind over 30 yrs
- 98.0%
Air-quality risk 2/10 · Minimal
- Unhealthy air days now
- 2 days/yr
- Unhealthy air days in 30 yrs
- 2 days/yr
Risk factors via First Street. Map © Google.
Why this score? — see what drove the C grade
The composite is a weighted blend of 9 inputs, each scored 0–100. Each bar is that input's sub-score; the figure is the points it added to the 100-point composite (weight × sub-score).
- Cash flow +23.3/30.0
- DSCR +7.5/10.0
- ARV discount +7.5/15.0
- 1% rule +6.1/10.0
- Schools +3.6/10.0
- Livability +3.4/5.0
- Rent growth +3.2/5.0
- Condition / age +2.5/5.0
- Appreciation +0.0/10.0
$210,000
🖨 Deal sheet (PDF) 📄 Offer letter ✓ Due diligence
Listing remarks
3-bedroom, 2-bath manufactured home situated on 0.95 acres with no HOA. The property offers plenty of space and flexibility for a variety of uses. While the home needs some work, it provides a solid opportunity for a buyer to renovate and customize to their vision. A great option for someone looking for land, freedom from HOA restrictions, and potential to add value.
Key facts
- 0.95 acres
- No hoa
- 0.95 acre lot
Tags
Neighborhood map
What this means for you Summary
Snapshot
- This is a 3-bed/2.0-bath manufactured listed at $210k.
Deal economics
- At list price, monthly cash flow is $384 ($5k/yr) — positive.
- The deal already cash-flows at list — no discount required.
- Meets the 1% rule at list price ($2k rent vs $210k).
- Cap rate 8.5% vs local median 4.0% in Goose Creek — top-decile yield for the area; either an underpriced asset or a hidden risk that comps aren't pricing in. Stress-test before assuming the spread holds.
Location & tenants
- Location reads 67/100 on livability (#103 in SC) — a middle-class / working-renter tenant base. Strengths: housing A+, employment A, cost of living B+; Watch: amenities F, commute F, health & safety F.
- Berkeley 01 (suburban): math 35% / reading 48% proficiency, ranked #30 of 80 in SC (top 38%) — families likely to look elsewhere, expect single-tenant / working-renter base with shorter leases.
- Zoned schools: Cane Bay Elementary (math 57% / reading 55%, grade C+, #109 of 597 statewide, top 19%, 1,263 students, 28% FRL); Cane Bay Middle (math 29% / reading 47%, grade F, #86 of 229 statewide, top 39%, 1,487 students, 30% FRL); Cane Bay High (math 50% / reading 84%, grade B, #73 of 196 statewide, top 41%, 2,158 students, 28% FRL) — zoned schools average 29% FRL vs 48% district-wide (20 pts lower); this property's tenant base skews higher-income than the district average.
- Zoned-school proficiency averages 54% at this address vs 42% district-wide (+12 pts) — the actual schools serving this property are materially stronger than the Berkeley 01 average implies; a family-tenant draw the district grade alone would hide.
- Market conditions: Rents rising (+2.7%/yr); 1301 active listings in the ZIP; 8 comparable units currently listed for rent nearby; rentals at typical pace (median 16d on market — plan ~3-4 weeks tenant-placement turnaround); solid renter incomes; 3,183 units permitted in Berkeley County in 2024 (580 in 5+ unit buildings).
- This rent runs 31% of the median local income ($90k/yr) — at the standard rent-burdened threshold; future hikes will face affordability resistance.
Forward outlook
- Local home prices are declining (-3.0%/yr); year-one equity from $1k of loan paydown is wiped out by about $6k of value loss. Plan a longer hold.
- Berkeley County population projected at +48% by 2050 — long-run rental-demand tailwind backs the buy-and-hold thesis.
Negotiation context
- Only 14 days on market — expect competitive offers; lowballing is unlikely to land.
- Current owner paid $16k; list at $210k implies a 1221% gain — meaningful room to come down on a strong offer.
Risks & watch-outs
- Climate carrying-cost: severe wind risk, 98% chance of damaging wind over 30y; moderate wildfire risk; extreme-heat days projected 7→17/yr by 2055 (HVAC capex compounding) — expect insurance premiums to compound above CPI over the hold.
Questions for the listing agent
- Is there a deadline driving the sale (1031 exchange, divorce, estate, relocation)? That informs how much negotiation room exists.
- What's the average days-on-market for RENTAL listings here right now (not sales)? A rising rental-DOM trend means longer vacancies and softer asking-rent achievability than the comps imply.
- What's the recent tenant-quality profile in this submarket — average credit score on applications, eviction rate, late-payment / NSF rate, and stable-employment percentage? A property-management company in the area should have these aggregated.
- How much new for-sale + rental construction is in the pipeline within 1–3 miles? Heavy new supply typically softens prices + rents 12–24 months out; constrained supply supports both.
Investment metrics
- 1% rule
- 1.11% ✓
- Cap rate
- 8.49%
- Cash-on-cash
- 7.85%
- DSCR
- 1.35
- GRM
- 7.5
CMA / ARV
No comps found within radius.
Projected returns pro-forma
-3.0% appreciation · 2.67% rent growth · sell at horizon
- IRR
- -4.7%
- Equity multiple
- 0.83×
- Total profit
- $-10,280
- Equity at exit
- $31,312
- IRR
- 4.6%
- Equity multiple
- 1.33×
- Total profit
- $19,583
- Equity at exit
- $18,157
Cash invested: $58,800 (down + closing). Projections, not guarantees.
Landlord ↔ Tenant lean methodology
- Overall (STATE)
- 90 Strongly Landlord-Friendly
- State South Carolina
- 90 Strongly Landlord-Friendly · R+6
- County
- — inherits STATE
- City
- — inherits STATE
ZIP-level market 29486
- Home prices YoY
- -15.6%
- Rents YoY
- 2.7%
- Active inventory
- 1301
- Price-to-rent
- 7.5×
Monthly cashflow live
- Estimated rent
- $2,324 high interval (Pro) →
- Mortgage (P&I)
- −$1,101
- Tax est. 1.5%
- −$262 /mo · $3,150/yr
- Insurance
- −$88
- HOA
- −$0
- Vacancy / Maint / Mgmt
- −$488
- Net cashflow
- $384
Break-even live
Sensitivity live
| Price | -10% $530 | -5% $457 | +0% $384 | +5% $312 | +10% $239 |
|---|---|---|---|---|---|
| Rent | -10% $201 | -5% $293 | +0% $384 | +5% $476 | +10% $568 |
| Rate | -1.0pp $490 | -0.5pp $438 | base $384 | +0.5pp $330 | +1.0pp $275 |
UW: 25.0% down · 7.5% · 30yr · 1.5% tax · 5.0% vac · 8.0% maint · 8.0% mgmt
Financing live
Cash to close
- Down payment
- $52,500
- Closing costs
- $6,300
- Reserves months
- —
- Total cash needed
- —
Loan-product check · same deal, 3 products live
Conventional
25% down · 7.5% · 30yr
- Down + closing
- —
- Monthly P&I
- —
- Monthly cashflow
- —
- DSCR
- —
- Eligible?
- —
Personal DTI + credit; lowest rate.
DSCR
20% down · 8.5% · 30yr
- Down + closing
- —
- Monthly P&I
- —
- Monthly cashflow
- —
- DSCR
- —
- Eligible?
- —
No personal income docs; deal must DSCR.
Hard money
10% down · 12.0% · 12mo
- Down + closing
- —
- Monthly P&I
- —
- Monthly cashflow
- —
- DSCR
- —
- Eligible?
- —
Short-term bridge; refi at stabilization.
Rent comps 8 comps
| Address | Beds | Baths | Sqft | Rent | $/sqft | DOM | Units | Dist |
|---|---|---|---|---|---|---|---|---|
| 318 Deep River Rd Summerville, SC | 4.0 | 2.0 | 1689 | $2,349 | $1.39 | 15d | 1 | 0.69mi |
| 168 Sea Lavender Ln Summerville, SC | 2.0 | 2.0 | 1385 | $2,000 | $1.44 | 24d | 1 | 0.92mi |
| 214 New Grade Rd Moncks Corner, SC | 4.0 | 2.5 | 1650 | $2,100 | $1.27 | 24d | 1 | 1.06mi |
| 318 Oyster Bay Dr Summerville, SC | 2.0 | 2.0 | 1760 | $2,700 | $1.53 | 11d | 1 | 1.10mi |
| 900 Owl Wood Ln Summerville, SC | 3.0 | 2.0 | 1311 | $2,273 | $1.73 | 4d | 1 | 1.16mi |
| 900 Owl Wood Ln Summerville, SC | 2.0 | 2.0 | 1157 | $2,385 | $2.06 | 24d | 1 | 1.16mi |
| 195 N Creek Dr Summerville, SC | 2.0 | 2.0 | 1238 | $1,995 | $1.61 | 15d | 1 | 1.37mi |
| 900 Emblem St Summerville, SC | 1.0–3.0 | 1.0–2.0 | 1086 | $2,159 | $1.99 | 4d | 21 | 1.37mi |
Listing history 3 events
-
2026-02-05status Pending
-
2026-01-22$210,000 Active
-
1988-06-14soldstatus $15,900
ⓘ Source: listings_history table (triggers on properties + properties_extension) + one-shot
backfill from property_details.listing_events for pre-trigger history.
Climate risk First Street
- Flood 1/10 Low FEMA zone X (unshaded) · 0% chance over 30 yrs
- Wildfire 5/10 Major
- Heat 9/10 Extreme 7 d/yr ≥107°F today · 17 d/yr by 30 yrs out
- Wind 8/10 Severe 98% chance of damaging wind over 30 yrs
- Air quality 2/10 Low 2 unhealthy d/yr today · 2 by 30 yrs out
Nearby sold comps map
Loading sold comps map…
Walkable amenities ~0.75 mi
Loading nearby amenities…
Taxation est. · year 1
- Rental income
- $27,884
- − Mortgage interest
- −$11,763
- − Property taxes
- −$3,150
- − Insurance
- −$1,050
- − Repairs & maintenance
- −$2,231
- − Management
- −$2,231
- − Depreciation
- −$6,109
- Taxable income
- $1,350
- Est. tax owed @ 24.0%
- −$324
- After-tax cash flow
- $4,289/yr
For passive investors: Depreciation is non-cash, so a rental often shows a tax loss while cash-flowing — sheltering income. Rental losses are passive: they offset passive income freely, and up to $25,000/yr can offset ordinary (W-2) income if you actively participate and your MAGI is under $100k (phasing out to $0 by $150k); unused losses carry forward. On sale, claimed depreciation is recaptured at up to 25%, and gains may owe capital-gains tax (a 1031 exchange can defer both). Figures are a year-1 estimate at your 24.0% rate — not tax advice; consult a CPA.
Schools (NCES district)
- District
- Berkeley 01
- NCES district ID
- 4501170
- Math proficiency
- 35% ▼ -8.00%
- Reading proficiency
- 48% ▼ -2.00%
- Median HH income
- $52,724
- Composite
- 35.95/100
- National rank
- #4799
- State rank
- #30 of 80 in SC
Livability — Goose Creek
- Score
- 67/100
- State rank
- #103
- US rank
- #10912
Category grades
Schools grade is shown separately in the Schools card above.
Census & demographics
- County
- Berkeley County · 198,768 people
- City population
- 59,227
- Metro
- Charleston-North Charleston, SC
- Population (ZIP)
- 53,975
- Household income
- $89,578
- Rent vs Own
- Severe rent burden
- 1017.0
Population outlook (Berkeley County) Hauer SSP2
- Today (2025)
- 254,184 people
- By 2030
- 279,677 · +10.0%
- By 2040
- 329,379 · +29.6%
- By 2050
- 375,557 · +47.8%
- By 2075
- 476,740 · +87.6%
- By 2100
- 535,945 · +110.8%
Race, ethnicity, and origin ACS 2023
- Neighborhood character
- Diverse neighborhood (Simpson 0.56)
- Race & ethnicity
- White 62% Black 19% Two or more races 10% Hispanic / Latino 10% Asian 2%
- Hispanic origin (detail)
- Mexican 4% Puerto Rican 2%
- Common ancestry
- Lithuanian 4% Italian 2% Romanian 2%
- Foreign-born
- 5% · Canada, Jamaica
- Languages at home
- 91% English-only · Spanish 6% German/W. Germanic 1%
Political lean MEDSL · Berkeley
- 2024 margin
- R (+16.3) · D 41.1% · R 57.4% · Other 1.4%
- 2008→2024 swing
- -3.2pp toward R · 2008: -13.1pp · 2024: -16.3pp
- All cycles
- 2024: R+16.3 2020: R+11.7 2016: R+17.4 2012: R+18.9 2008: R+13.1
Not yet ingested
- Civics
- —
Market trends
- HPI YoY
- ▼ -52.74%
- Current HPI
- 285.0567
- Rent YoY
- ▲ 2.67%
- Metro
- Charleston-North Charleston, SC
- State GDP YoY
- ▲ 4.51%
- F500 in state
- 2
Industry mix (Fortune 500 HQ in SC)
| Industry | F500 HQs | Revenue |
|---|---|---|
| Packaging | 1 | $7B |
|
||
Price history
+1220.8% since first listed3 events — show timeline
- 2026-02-05 Pending — Charleston Trident MLS
- 2026-01-22 Listed $210,000 Charleston Trident MLS
- 1988-06-14 Sold (Public Records) $15,900 Public Records
Property tax history
-1.8%/yrLatest (2025): $362 · +8.2% YoY. Source: county tax records.
Cash-flow waterfall
monthlySold comps — $/sqft
last 12 mo · ≤1 miLoading sold comps…