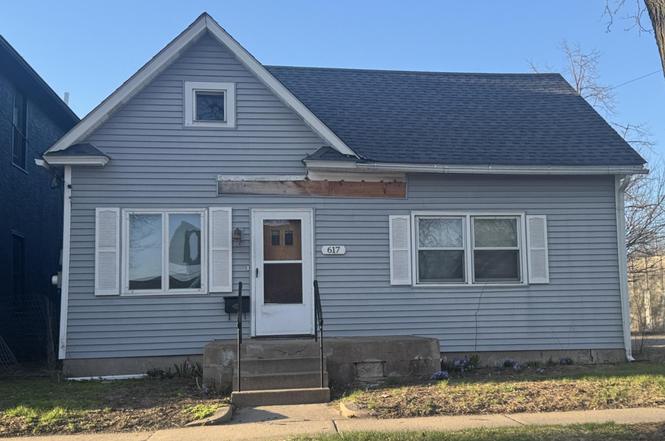
617 24th Ave NE
Minneapolis, MN 55418
$199,900C
2 bd · 1.0 ba ·
1,680 sqft ·
Built 1907
· SingleFamily
· Pending
· 109 DOM
Cashflow @ list (25.0% down · 7.5%)
Estimated rent
$2,208/mo
Mortgage (P&I)
−$1,048
Tax + insurance
−$384
HOA
−$0
Vac / Maint / Mgmt
−$464
Net cashflow
$313/mo
Annual
$3,753/yr
Cap rate
8.17%
Cash-on-cash
6.71%
DSCR
1.30
1% rule
1.10%
Cash to close
$55,972
Investor read
- This is a 2-bed/1.0-bath single-family listed at $200k.
- At list price, monthly cash flow is $313 ($4k/yr) — positive.
- The deal already cash-flows at list — no discount required.
- Meets the 1% rule at list price ($2k rent vs $200k).
- It's been on market 109 days — a 9% lower offer ($182k) is reasonable based on typical stale-listing flexibility.
- Recommended offer: $182k (9.0% below list) — sets the bar for market timing.
- Local home prices are declining (-3.0%/yr); year-one equity from $1k of loan paydown is wiped out by about $6k of value loss. Plan a longer hold.
- Location reads 78/100 on livability (#110 in MN, #2,525 nationally) — a middle-class / working-renter tenant base. Strengths: amenities A+, commute A+, housing A+; Watch: cost of living C-, crime F.
- Minneapolis Public School District (urban): math 35% / reading 46% proficiency, ranked #217 of 301 in MN (top 72%) — families likely to look elsewhere, expect single-tenant / working-renter base with shorter leases.
- Watch-outs: built in 1907 — expect roof / HVAC / electrical / plumbing capex.
- Market conditions: Rents rising fast (+5.2%/yr); 162 active listings in the ZIP; 18 comparable units currently listed for rent nearby; rentals lingering (median 44d on market — plan ~5-8 weeks vacancy on turnover, expect pricing pressure); 50% of comp listings sitting > 30 days — soft ceiling on asking rent; solid renter incomes; 4,651 units permitted in Hennepin County in 2024 (2,443 in 5+ unit buildings).
- Hennepin County population projected at +30% by 2050 — long-run rental-demand tailwind backs the buy-and-hold thesis.
- 2 sale attempts; this cycle's ask has dropped $30k (13%) from the opening price — seller is motivated, your offer sets the floor, not the list.
- Cap rate 8.2% vs local median 3.1% in Minneapolis — top-decile yield for the area; either an underpriced asset or a hidden risk that comps aren't pricing in. Stress-test before assuming the spread holds.
Questions for listing agent
- It's been on market 109 days. Have you received any prior offers? Is the seller open to a 9% concession, seller financing, or rate buy-down credit?
- Built in 1907 — when were the roof, HVAC, electrical panel, plumbing, and water heater last replaced?
- Why hasn't it sold? Are there any deal-killer items the seller is aware of (foundation, flood, title, zoning, code violations)?
- Is there a deadline driving the sale (1031 exchange, divorce, estate, relocation)? That informs how much negotiation room exists.
- Crime grade is F in this area — have there been break-ins, vandalism, or insurance claims at this property in the last 3 years? What carrier currently insures it and at what premium?
- What's the average days-on-market for RENTAL listings here right now (not sales)? A rising rental-DOM trend means longer vacancies and softer asking-rent achievability than the comps imply.
- What's the recent tenant-quality profile in this submarket — average credit score on applications, eviction rate, late-payment / NSF rate, and stable-employment percentage? A property-management company in the area should have these aggregated.
- How much new for-sale + rental construction is in the pipeline within 1–3 miles? Heavy new supply typically softens prices + rents 12–24 months out; constrained supply supports both.
CashFlowRE · CFR-5F1ZMT2X2BJCSF
· Data 3 weeks ago
cashflowre.app · 2026-05-29