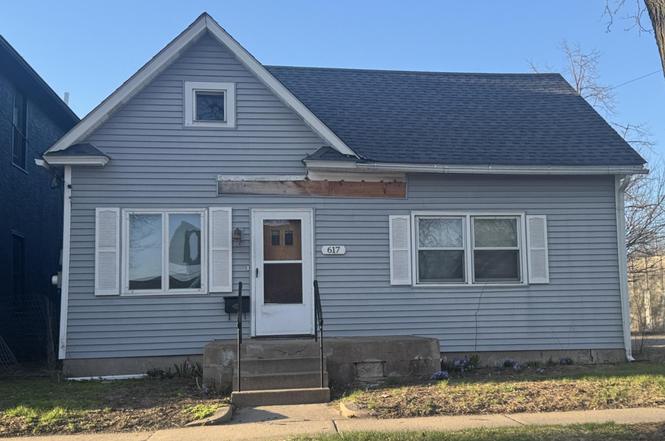
617 24th Ave NE · Minneapolis, MN
Flood risk 1/10 · Minimal
- FEMA flood zone
- X (unshaded)
- Chance of flooding over 30 yrs
- 0.0%
- Est. flood insurance / yr
- $473 – $860
Fire risk 1/10 · Minimal
- Est. fire insurance / yr
- $888 – $1,650
Heat risk 2/10 · Minimal
- Hot days now (above 100°F)
- 7 days/yr
- Hot days in 30 yrs
- 14 days/yr
Wind risk 2/10 · Minimal
- Chance of severe wind over 30 yrs
- —
Air-quality risk 2/10 · Minimal
- Unhealthy air days now
- 1 days/yr
- Unhealthy air days in 30 yrs
- 1 days/yr
Risk factors via First Street. Map © Google.
Why this score? — see what drove the C grade
The composite is a weighted blend of 9 inputs, each scored 0–100. Each bar is that input's sub-score; the figure is the points it added to the 100-point composite (weight × sub-score).
- Cash flow +21.8/30.0
- ARV discount +7.5/15.0
- DSCR +7.0/10.0
- 1% rule +6.0/10.0
- Livability +3.9/5.0
- Rent growth +3.8/5.0
- Schools +3.5/10.0
- Condition / age +2.5/5.0
- Appreciation +0.0/10.0
$199,900
🖨 Deal sheet 📄 Offer letter ✓ Due diligence
Listing remarks
617 24th Avenue NE offers a cozy 2-bedroom, 1-bath single-family home on a generous lot in a vibrant Minneapolis neighborhood. With a thoughtful location near essential services and desirable community amenities, this property presents both an affordable entry into Northeast Minneapolis housing and opportunities for customization and investment growth.
Key facts
- 4,620 sq ft lot
- 2 garage spots
- Built 1907
Property features AI
Exterior
- Parking: Driveway with other surface; 2-car garage (28 x 24, 7' tall door, 8' wide door)
- Utilities: City water connected; City sewer connected; Natural gas; Electric service with circuit breakers (100 Amp) supplied by Xcel Energy
- Home design: Residential property; One and one-half stories; Entry and main living on main level
- Construction: Frame construction; Asphalt roof (age over 8 years); Stone foundation
- Exterior features: Corner lot with light tree coverage; Deck; Vinyl exterior; No fencing; City street frontage with curbs; Publicly maintained road
Interior
- Kitchen: Kitchen on main level; Appliances: Other
- Bedrooms: Two bedrooms (one on the main level, one on the upper loft)
- Flooring: Hardwood floors
- Bathrooms: One full bath on the main level
- Heating & cooling: Forced air heating; Central air conditioning
- Interior features: All living facilities on one level; Main floor bedroom; Main floor laundry; Living/Dining room; Walk-up attic
- Laundry & utility: Main level laundry; Washer/dryer hookup
Neighborhood map
What this means for you Summary
Snapshot
- This is a 2-bed/1.0-bath single-family listed at $200k.
Deal economics
- At list price, monthly cash flow is $313 ($4k/yr) — positive.
- The deal already cash-flows at list — no discount required.
- Meets the 1% rule at list price ($2k rent vs $200k).
- Recommended offer: $182k (9.0% below list) — sets the bar for market timing.
- Cap rate 8.2% vs local median 3.1% in Minneapolis — top-decile yield for the area; either an underpriced asset or a hidden risk that comps aren't pricing in. Stress-test before assuming the spread holds.
Location & tenants
- Location reads 78/100 on livability (#110 in MN, #2,525 nationally) — a middle-class / working-renter tenant base. Strengths: amenities A+, commute A+, housing A+; Watch: cost of living C-, crime F.
- Minneapolis Public School District (urban): math 35% / reading 46% proficiency, ranked #217 of 301 in MN (top 72%) — families likely to look elsewhere, expect single-tenant / working-renter base with shorter leases.
- Market conditions: Rents rising fast (+5.2%/yr); 162 active listings in the ZIP; 18 comparable units currently listed for rent nearby; rentals lingering (median 44d on market — plan ~5-8 weeks vacancy on turnover, expect pricing pressure); 50% of comp listings sitting > 30 days — soft ceiling on asking rent; solid renter incomes; 4,651 units permitted in Hennepin County in 2024 (2,443 in 5+ unit buildings).
Forward outlook
- Local home prices are declining (-3.0%/yr); year-one equity from $1k of loan paydown is wiped out by about $6k of value loss. Plan a longer hold.
- Hennepin County population projected at +30% by 2050 — long-run rental-demand tailwind backs the buy-and-hold thesis.
Negotiation context
- It's been on market 109 days — a 9% lower offer ($182k) is reasonable based on typical stale-listing flexibility.
- 2 sale attempts; this cycle's ask has dropped $30k (13%) from the opening price — seller is motivated, your offer sets the floor, not the list.
Risks & watch-outs
- Watch-outs: built in 1907 — expect roof / HVAC / electrical / plumbing capex.
Questions for the listing agent
- It's been on market 109 days. Have you received any prior offers? Is the seller open to a 9% concession, seller financing, or rate buy-down credit?
- Built in 1907 — when were the roof, HVAC, electrical panel, plumbing, and water heater last replaced?
- Why hasn't it sold? Are there any deal-killer items the seller is aware of (foundation, flood, title, zoning, code violations)?
- Is there a deadline driving the sale (1031 exchange, divorce, estate, relocation)? That informs how much negotiation room exists.
- Crime grade is F in this area — have there been break-ins, vandalism, or insurance claims at this property in the last 3 years? What carrier currently insures it and at what premium?
- What's the average days-on-market for RENTAL listings here right now (not sales)? A rising rental-DOM trend means longer vacancies and softer asking-rent achievability than the comps imply.
- What's the recent tenant-quality profile in this submarket — average credit score on applications, eviction rate, late-payment / NSF rate, and stable-employment percentage? A property-management company in the area should have these aggregated.
- How much new for-sale + rental construction is in the pipeline within 1–3 miles? Heavy new supply typically softens prices + rents 12–24 months out; constrained supply supports both.
Investment metrics
- 1% rule
- 1.10% ✓
- Cap rate
- 8.17%
- Cash-on-cash
- 6.71%
- DSCR
- 1.30
- GRM
- 7.5
CMA / ARV
No comps found within radius.
Projected returns pro-forma
-3.0% appreciation · 5.19% rent growth · sell at horizon
- IRR
- -3.5%
- Equity multiple
- 0.87×
- Total profit
- $-7,434
- Equity at exit
- $29,806
- IRR
- 8.6%
- Equity multiple
- 1.73×
- Total profit
- $40,780
- Equity at exit
- $17,284
Cash invested: $55,972 (down + closing). Projections, not guarantees.
Landlord ↔ Tenant lean methodology
- Overall (CITY)
- 34 Tenant-Leaning
- State Minnesota
- 46 Balanced · D+2
- County
- — inherits STATE
- City Minneapolis
- 34 Tenant-Leaning · D+50
ZIP-level market 55418
- Rents YoY
- 5.2%
- Active inventory
- 162
- Price-to-rent
- 7.5×
Monthly cashflow live
- Estimated rent
- $2,208 high interval (Pro) →
- Mortgage (P&I)
- −$1,048
- Tax from tax record
- −$300 /mo · $3,603/yr
- Insurance
- −$83
- HOA
- −$0
- Vacancy / Maint / Mgmt
- −$464
- Net cashflow
- $313
Break-even live
UW: 25.0% down · 7.5% · 30yr · 1.5% tax · 5.0% vac · 8.0% maint · 8.0% mgmt
Financing live
Cash to close
- Down payment
- $49,975
- Closing costs
- $5,997
- Reserves months
- —
- Total cash needed
- —
Loan-product check · same deal, 3 products live
Conventional
25% down · 7.5% · 30yr
- Down + closing
- —
- Monthly P&I
- —
- Monthly cashflow
- —
- DSCR
- —
- Eligible?
- —
Personal DTI + credit; lowest rate.
DSCR
20% down · 8.5% · 30yr
- Down + closing
- —
- Monthly P&I
- —
- Monthly cashflow
- —
- DSCR
- —
- Eligible?
- —
No personal income docs; deal must DSCR.
Hard money
10% down · 12.0% · 12mo
- Down + closing
- —
- Monthly P&I
- —
- Monthly cashflow
- —
- DSCR
- —
- Eligible?
- —
Short-term bridge; refi at stabilization.
Rent comps 18 comps
| Address | Beds | Baths | Sqft | Rent | $/sqft | DOM | Units | Dist |
|---|---|---|---|---|---|---|---|---|
| 636 22nd Ave NE Minneapolis, MN | 3.0–4.0 | 2.5 | 1625 | $3,090 | $1.90 | 1d | 3 | 0.17mi |
| 2522 5th St NE Minneapolis, MN | 3.0 | 1.0 | 1200 | $1,799 | $1.50 | 43d | 1 | 0.19mi |
| 690 NE Lowry Ave Unit 1 Minneapolis, MN | 3.0 | 1.0 | 1082 | $2,345 | $2.17 | 4d | 1 | 0.26mi |
| 207 24th Ave NE Minneapolis, MN | 3.0 | 3.0 | 1575 | $2,995 | $1.90 | 43d | 1 | 0.38mi |
| 233 26th Ave NE Minneapolis, MN | 3.0 | 1.0 | 1153 | $1,545 | $1.34 | 43d | 1 | 0.41mi |
| 2015 Central Ave NE Minneapolis, MN | 1.0–2.0 | 1.0 | 902 | $1,600 | $1.77 | 43d | 4 | 0.58mi |
| 1431 Jefferson St NE Minneapolis, MN | 3.0 | 1.0 | 1100 | $1,700 | $1.55 | 43d | 1 | 0.65mi |
| 900 14th Ave NE Minneapolis, MN | 2.0 | 1.0–2.0 | 876 | $1,610 | $1.84 | 2d | 13 | 0.82mi |
| 1428 Marshall St NE Minneapolis, MN | 3.0 | 2.5 | 1800 | $3,300 | $1.83 | 1d | 1 | 0.95mi |
| 912 4th St NE Minneapolis, MN | 3.0 | 1.0 | 1144 | $2,150 | $1.88 | 14d | 1 | 0.95mi |
| 624 Jefferson St NE Minneapolis, MN | 1.0 | 1.0 | 1100 | $1,200 | $1.09 | 14d | 1 | 1.12mi |
| 623 Spring St NE Unit 623 Minneapolis, MN | 3.0 | 2.0 | 1650 | $2,600 | $1.58 | 43d | 1 | 1.16mi |
| 2035 W River Rd Minneapolis, MN | 1.0–4.0 | 2.0 | 1034 | $1,730 | $1.67 | 4d | 10 | 1.29mi |
| 626 NE Taylor St Unit 1 Minneapolis, MN | 3.0 | 1.0 | 1250 | $1,875 | $1.50 | 43d | 1 | 1.31mi |
| 110 6th Ave NE Minneapolis, MN | 2.0 | 1.0–2.0 | 831 | $3,109 | $3.74 | 3d | 8 | 1.31mi |
| 318 N 27th Ave #2 Minneapolis, MN | 3.0 | 1.0 | 1200 | $1,800 | $1.50 | 43d | 1 | 1.33mi |
| 318 N 27th Ave #2 Minneapolis, MN | 3.0 | 1.0 | 1200 | $1,800 | $1.50 | 4d | 1 | 1.33mi |
| 414 N 33rd Ave Unit 2 Minneapolis, MN | 2.0 | 1.0 | 1246 | $1,600 | $1.28 | 43d | 1 | 1.38mi |
Listing history 9 events
-
2026-05-05status Pending
-
2026-04-25historical Contingent - Inspection
-
2026-03-18price $199,900
-
2026-03-11status Active
-
2026-03-11price $209,900
-
2026-03-07historical
-
2026-02-17price $219,900
-
2026-01-13$229,900 Active
-
2026-01-06historical $229,900
ⓘ Source: listings_history table (triggers on properties + properties_extension) + one-shot
backfill from property_details.listing_events for pre-trigger history.
Tax reassessment forecast MN · Partial reset (capped growth)
- Current annual tax
- $3,603 · $300/mo
- Projected year-2 tax
- $3,603 · $300/mo
- Expected delta
- $0/yr ($0/mo · 0.0%)
ⓘ Screening estimate from a state-policy table — verify with the county assessor before closing.
Climate risk First Street
- Flood 1/10 Low FEMA zone X (unshaded) · 0% chance over 30 yrs
- Wildfire 1/10 Low
- Heat 2/10 Low 7 d/yr ≥100°F today · 14 d/yr by 30 yrs out
- Wind 2/10 Low
- Air quality 2/10 Low 1 unhealthy d/yr today · 1 by 30 yrs out
Nearby sold comps map
Loading sold comps map…
Walkable amenities ~0.75 mi
Loading nearby amenities…
Taxation est. · year 1
- Rental income
- $26,501
- − Mortgage interest
- −$11,198
- − Property taxes
- −$3,603
- − Insurance
- −$1,000
- − Repairs & maintenance
- −$2,120
- − Management
- −$2,120
- − Depreciation
- −$5,815
- Taxable income
- $645
- Est. tax owed @ 24.0%
- −$155
- After-tax cash flow
- $3,599/yr
For passive investors: Depreciation is non-cash, so a rental often shows a tax loss while cash-flowing — sheltering income. Rental losses are passive: they offset passive income freely, and up to $25,000/yr can offset ordinary (W-2) income if you actively participate and your MAGI is under $100k (phasing out to $0 by $150k); unused losses carry forward. On sale, claimed depreciation is recaptured at up to 25%, and gains may owe capital-gains tax (a 1031 exchange can defer both). Figures are a year-1 estimate at your 24.0% rate — not tax advice; consult a CPA.
Schools (NCES district)
- District
- Minneapolis Public School District
- NCES district ID
- 2721240
- Math proficiency
- 35% ▼ -7.00%
- Reading proficiency
- 46% ▼ -1.00%
- Median HH income
- $50,521
- Composite
- 34.92/100
- National rank
- #5067
- State rank
- #217 of 301 in MN
Livability — Minneapolis
- Score
- 78/100
- State rank
- #110
- US rank
- #2525
Category grades
Schools grade is shown separately in the Schools card above.
Census & demographics
- Census place
- Minneapolis, MN
- County
- Hennepin County · 1,150,272 people
- City population
- 40,819
- Metro
- Minneapolis-St. Paul-Bloomington, MN-WI
- Population (ZIP)
- 31,505
- Household income
- $99,397
- Rent vs Own
- Severe rent burden
- 1179.0
Population outlook (Hennepin County) Hauer SSP2
- Today (2025)
- 1,405,227 people
- By 2030
- 1,492,650 · +6.2%
- By 2040
- 1,660,157 · +18.1%
- By 2050
- 1,823,498 · +29.8%
- By 2075
- 2,221,283 · +58.1%
- By 2100
- 2,509,976 · +78.6%
Race, ethnicity, and origin ACS 2023
- Neighborhood character
- Predominantly White (74%)
- Race & ethnicity
- White 74% Black 9% Hispanic / Latino 8% Two or more races 7% Asian 2%
- Hispanic origin (detail)
- Mexican 3%
- Common ancestry
- Portuguese 14% Romanian 6% Lithuanian 3%
- Foreign-born
- 11% · Canada, Vietnam, South Korea
- Languages at home
- 86% English-only · Spanish 5% Other Indo-European 1% German/W. Germanic 1%
Political lean MEDSL · Hennepin
- 2024 margin
- Solid D (+42.6) · D 70.2% · R 27.5% · Other 2.3%
- 2008→2024 swing
- +14.0pp toward D · 2008: 28.6pp · 2024: 42.6pp
- All cycles
- 2024: D+42.6 2020: D+43.2 2016: D+35.3 2012: D+27.1 2008: D+28.6
Not yet ingested
- Civics
- —
Market trends
- HPI YoY
- ▼ -278.21%
- Current HPI
- 277.9846
- Rent YoY
- ▲ 5.19%
- Metro
- Minneapolis-St. Paul-Bloomington, MN-WI
- State GDP YoY
- ▲ 2.41%
- F500 in state
- 34
Industry mix (Fortune 500 HQ in MN)
| Industry | F500 HQs | Revenue |
|---|---|---|
| Healthcare | 2 | $407B |
|
||
| Retail | 2 | $150B |
|
||
| Consumer Goods | 2 | $32B |
|
||
| Industrial Machinery | 2 | $6B |
|
||
| Agriculture | 1 | $40B |
|
||
| Healthcare / Medical Devices | 1 | $32B |
|
||
Price history
-13.0% since first listed9 events — show timeline
- 2026-05-05 Pending — NORTHSTARMLS as Distributed by MLS Grid
- 2026-04-25 Contingent — NORTHSTARMLS as Distributed by MLS Grid
- 2026-03-18 Price Changed $199,900 NORTHSTARMLS as Distributed by MLS Grid
- 2026-03-11 Relisted — NORTHSTARMLS as Distributed by MLS Grid
- 2026-03-11 Price Changed $209,900 NORTHSTARMLS as Distributed by MLS Grid
- 2026-03-07 Listing Removed — NORTHSTARMLS as Distributed by MLS Grid
- 2026-02-17 Price Changed $219,900 NORTHSTARMLS as Distributed by MLS Grid
- 2026-01-13 Listed $229,900 NORTHSTARMLS as Distributed by MLS Grid
- 2026-01-06 Coming Soon $229,900 NORTHSTARMLS as Distributed by MLS Grid
Property tax history
+5.0%/yrLatest (2025): $3,603 · +7.3% YoY. Source: county tax records.
Cash-flow waterfall
monthlySold comps — $/sqft
last 12 mo · ≤1 miLoading sold comps…