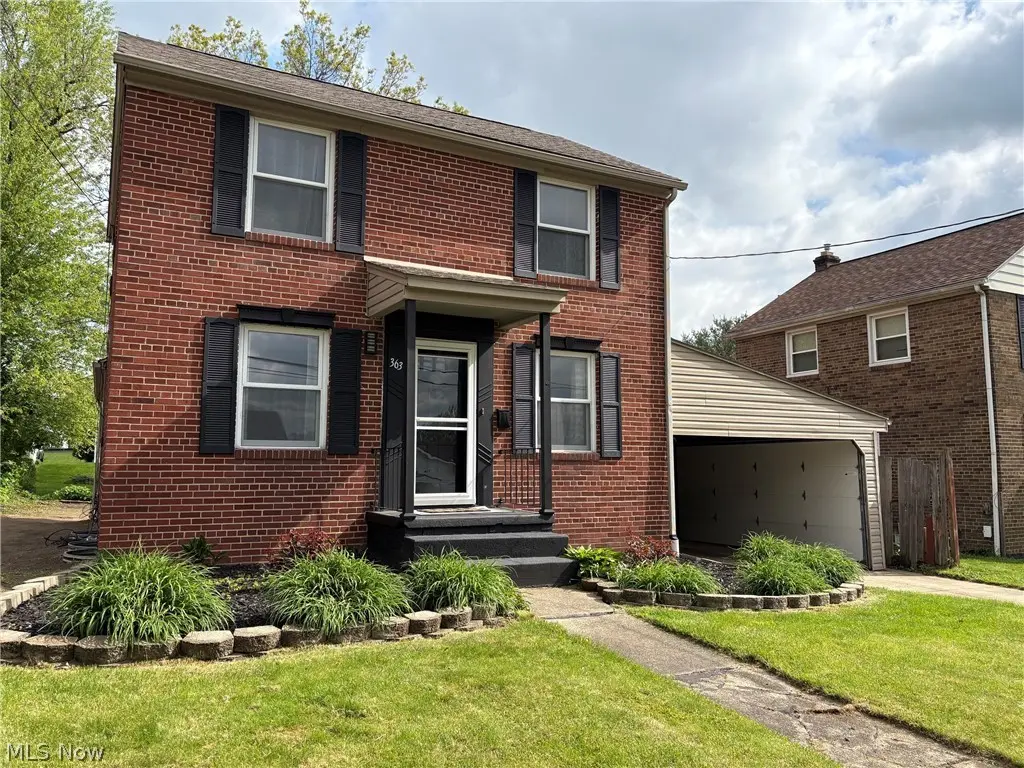
363 E Park Ave
Barberton, OH 44203
$189,000F
3 bd · 1.5 ba ·
1,464 sqft ·
Built 1943
· SingleFamily
· Pending
· 5 DOM
Cashflow @ list (25.0% down · 7.5%)
Estimated rent
$1,399/mo
Mortgage (P&I)
−$991
Tax + insurance
−$273
HOA
−$0
Vac / Maint / Mgmt
−$294
Net cashflow
$-158/mo
Annual
$-1,900/yr
Cap rate
5.29%
Cash-on-cash
-3.59%
DSCR
0.84
1% rule
0.74%
Cash to close
$52,920
Investor read
- This is a 3-bed/1.5-bath single-family listed at $189k.
- At list price, monthly cash flow is $-158 ($-2k/yr) — negative.
- To cash-flow at today's rent, offer at most $161k (14.8% below list).
- To meet the 1% rule (rent ≥ 1% of price), the offer needs to be $140k (26.0% below list).
- Only 5 days on market — expect competitive offers; lowballing is unlikely to land.
- Recommended offer: $140k (26.0% below list) — sets the bar for 1% rule.
- Local home prices are declining (-3.0%/yr); year-one equity from $1k of loan paydown is wiped out by about $6k of value loss. Plan a longer hold.
- Location reads 71/100 on livability (#428 in OH) — a middle-class / working-renter tenant base. Strengths: cost of living A+, housing A+, health & safety A+; Watch: crime C-, amenities F, commute F.
- Barberton City (suburban): math 47% / reading 51% proficiency, ranked #466 of 656 in OH (top 71%) — families likely to look elsewhere, expect single-tenant / working-renter base with shorter leases; 62% free/reduced lunch — lower-income household profile, screen leases tightly.
- Zoned schools: Barberton Intermediate School (math 59% / reading 50%, grade C, #788 of 1,584 statewide, top 52%, 697 students, 74% FRL); Barberton Middle School (math 45% / reading 50%, grade C-, #444 of 654 statewide, top 69%, 797 students, 72% FRL); Barberton High School (math 33% / reading 57%, grade D-, #468 of 781 statewide, top 60%, 1,220 students, 60% FRL).
- Watch-outs: built in 1943 — expect roof / HVAC / electrical / plumbing capex.
- Market conditions: Rents rising fast (+5.9%/yr); 226 active listings in the ZIP; 7 comparable units currently listed for rent nearby; rentals at typical pace (median 16d on market — plan ~3-4 weeks tenant-placement turnaround); 1,114 units permitted in Summit County in 2024 (397 in 5+ unit buildings).
- Summit County population projected to shrink 6% by 2050 — rents likely to lag national; underwrite the cash flow, not the appreciation.
- 5 sale attempts since 20y ago with the ask held roughly flat each time — persistent listings suggest the price (not the market) is what's stuck; bring a comps-based counter.
- Current owner paid $94k; list at $189k implies a 101% gain — meaningful room to come down on a strong offer.
Questions for listing agent
- What do current leases actually rent for vs. the listed asking? Can we see a recent rent roll and the last 12 months of T-12 income?
- Built in 1943 — when were the roof, HVAC, electrical panel, plumbing, and water heater last replaced?
- Is there a deadline driving the sale (1031 exchange, divorce, estate, relocation)? That informs how much negotiation room exists.
- The area grade is low — what's the realistic commute time and amenity access for the typical tenant pool here? Any planned neighborhood developments (good or bad) we should know about?
- What's the average days-on-market for RENTAL listings here right now (not sales)? A rising rental-DOM trend means longer vacancies and softer asking-rent achievability than the comps imply.
- What's the recent tenant-quality profile in this submarket — average credit score on applications, eviction rate, late-payment / NSF rate, and stable-employment percentage? A property-management company in the area should have these aggregated.
- How much new for-sale + rental construction is in the pipeline within 1–3 miles? Heavy new supply typically softens prices + rents 12–24 months out; constrained supply supports both.
CashFlowRE · CFR-5FKEKZ9MHXR6NS
· Data 4 weeks ago
cashflowre.app · 2026-05-29