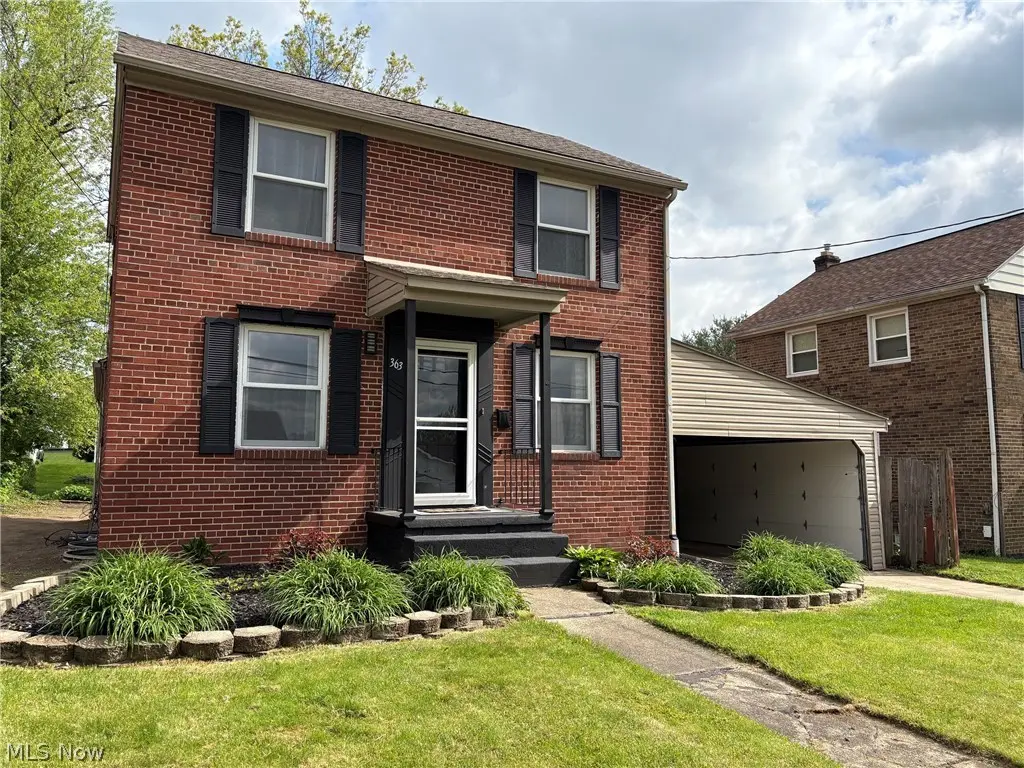
363 E Park Ave · Barberton, OH
Flood risk 1/10 · Minimal
- FEMA flood zone
- X (unshaded)
- Chance of flooding over 30 yrs
- 0.0%
- Est. flood insurance / yr
- $473 – $860
Fire risk 1/10 · Minimal
- Est. fire insurance / yr
- $713 – $1,323
Heat risk 3/10 · Minor
- Hot days now (above 96°F)
- 7 days/yr
- Hot days in 30 yrs
- 17 days/yr
Wind risk 1/10 · Minimal
- Chance of severe wind over 30 yrs
- —
Air-quality risk 2/10 · Minimal
- Unhealthy air days now
- 0 days/yr
- Unhealthy air days in 30 yrs
- 1 days/yr
Risk factors via First Street. Map © Google.
Why this score? — see what drove the F grade
The composite is a weighted blend of 9 inputs, each scored 0–100. Each bar is that input's sub-score; the figure is the points it added to the 100-point composite (weight × sub-score).
- Cash flow +8.7/30.0
- ARV discount +6.9/15.0
- Schools +4.1/10.0
- Rent growth +4.0/5.0
- Livability +3.6/5.0
- Condition / age +2.5/5.0
- 1% rule +2.4/10.0
- DSCR +2.4/10.0
- Appreciation +0.0/10.0
$189,000
🖨 Deal sheet (PDF) 📄 Offer letter ✓ Due diligence
Listing remarks MLS
Beautiful updated brick colonial w/ newer kitchen, wood floors, updated roof, furnace, HWT & gutters * woodburning fireplace * Nice size family room * Great yard * Freshly painted * 1/2 bath * Close to Hospital, shopping & park!!
Key facts
- Bookshelves
- Bonus room
- Updated home
Tags
Property features AI
Exterior
- Parking: Attached garage (1 car); Attached carport (2 spaces); Garage faces front
- Utilities: Public water; Public sewer
- Home design: 2-story home; Faces east; Entry level and detailed room levels include main and second floors
- Construction: Brick construction; Asphalt roof; Block foundation; Built from public records
- Exterior features: Partial fencing; Carports and garage structures
Interior
- Kitchen: Range; Refrigerator
- Bedrooms: Main level has 1 bedroom; Second floor bedrooms with carpeted floors
- Flooring: Carpet in bedrooms and upper-level rooms
- Bathrooms: 2 full bathrooms; 1 half bathroom; 1 bathroom on the main level
- Heating & cooling: Gas forced-air heating; Wall cooling units
- Interior features: Built-in bookcases; Ceiling fans; Coffered ceilings; Natural woodwork; Finished basement space (below grade)
- Laundry & utility: Washer and dryer located in the basement
Neighborhood map
What this means for you Summary
Snapshot
- This is a 3-bed/1.5-bath single-family listed at $189k.
Deal economics
- At list price, monthly cash flow is $-158 ($-2k/yr) — negative.
- To cash-flow at today's rent, offer at most $161k (14.8% below list).
- To meet the 1% rule (rent ≥ 1% of price), the offer needs to be $140k (26.0% below list).
- Recommended offer: $140k (26.0% below list) — sets the bar for 1% rule.
Location & tenants
- Location reads 71/100 on livability (#428 in OH) — a middle-class / working-renter tenant base. Strengths: cost of living A+, housing A+, health & safety A+; Watch: crime C-, amenities F, commute F.
- Barberton City (suburban): math 47% / reading 51% proficiency, ranked #466 of 656 in OH (top 71%) — families likely to look elsewhere, expect single-tenant / working-renter base with shorter leases; 62% free/reduced lunch — lower-income household profile, screen leases tightly.
- Zoned schools: Barberton Intermediate School (math 59% / reading 50%, grade C, #788 of 1,584 statewide, top 52%, 697 students, 74% FRL); Barberton Middle School (math 45% / reading 50%, grade C-, #444 of 654 statewide, top 69%, 797 students, 72% FRL); Barberton High School (math 33% / reading 57%, grade D-, #468 of 781 statewide, top 60%, 1,220 students, 60% FRL).
- Market conditions: Rents rising fast (+5.9%/yr); 226 active listings in the ZIP; 7 comparable units currently listed for rent nearby; rentals at typical pace (median 16d on market — plan ~3-4 weeks tenant-placement turnaround); 1,114 units permitted in Summit County in 2024 (397 in 5+ unit buildings).
Forward outlook
- Local home prices are declining (-3.0%/yr); year-one equity from $1k of loan paydown is wiped out by about $6k of value loss. Plan a longer hold.
- Summit County population projected to shrink 6% by 2050 — rents likely to lag national; underwrite the cash flow, not the appreciation.
Negotiation context
- Only 5 days on market — expect competitive offers; lowballing is unlikely to land.
- 5 sale attempts since 20y ago with the ask held roughly flat each time — persistent listings suggest the price (not the market) is what's stuck; bring a comps-based counter.
- Current owner paid $94k; list at $189k implies a 101% gain — meaningful room to come down on a strong offer.
Risks & watch-outs
- Watch-outs: built in 1943 — expect roof / HVAC / electrical / plumbing capex.
Questions for the listing agent
- What do current leases actually rent for vs. the listed asking? Can we see a recent rent roll and the last 12 months of T-12 income?
- Built in 1943 — when were the roof, HVAC, electrical panel, plumbing, and water heater last replaced?
- Is there a deadline driving the sale (1031 exchange, divorce, estate, relocation)? That informs how much negotiation room exists.
- The area grade is low — what's the realistic commute time and amenity access for the typical tenant pool here? Any planned neighborhood developments (good or bad) we should know about?
- What's the average days-on-market for RENTAL listings here right now (not sales)? A rising rental-DOM trend means longer vacancies and softer asking-rent achievability than the comps imply.
- What's the recent tenant-quality profile in this submarket — average credit score on applications, eviction rate, late-payment / NSF rate, and stable-employment percentage? A property-management company in the area should have these aggregated.
- How much new for-sale + rental construction is in the pipeline within 1–3 miles? Heavy new supply typically softens prices + rents 12–24 months out; constrained supply supports both.
Investment metrics
- 1% rule
- 0.74% ✗
- Cap rate
- 5.29%
- Cash-on-cash
- -3.59%
- DSCR
- 0.84
- GRM
- 11.3
CMA / ARV
- ARV (median comp)
- $186,331
- List price
- $189,000
- Delta
- 1.43%
- Verdict
- FAIR
- Comps
- 20 within 1.0 mi
Show comp detail 12 sales within ~0.75 mi
| Address | Dist | Beds/Ba | Sqft | Sold | Price | $/sf | Match |
|---|---|---|---|---|---|---|---|
| 414 E Baird Ave | 0.18mi | 3/1.5 | 1,593 (+9%) | 7mo | $180,000 | $113 | 71 |
| 524 Jefferson Ave | 0.57mi | 4/2.0 (+1) | 1,437 (-2%) | 1mo | $207,400 | $144 | 62 |
| 244 5th St NE | 0.25mi | 3/2.5 | 1,260 (-14%) | 4mo | $229,000 | $182 | 58 |
| 513 Franklin Ave | 0.53mi | 3/1.0 | 1,333 (-9%) | 1mo | $165,000 | $124 | 58 |
| 409 Franklin Ave | 0.46mi | 3/1.5 | 1,316 (-10%) | 6mo | $220,000 | $167 | 57 |
| 485 Lloyd St | 0.73mi | 4/1.5 (+1) | 1,433 (-2%) | 2mo | $156,500 | $109 | 56 |
| 650 E Tuscarawas Ave | 0.55mi | 4/2.0 (+1) | 1,411 (-4%) | 7mo | $235,000 | $167 | 55 |
| 43 S Van Buren Ave | 0.52mi | 2/1.0 (-1) | 1,344 (-8%) | 0mo | $153,000 | $114 | 55 |
| 613 Wooster Rd N | 0.69mi | 3/1.0 | 1,595 (+9%) | 2mo | $185,000 | $116 | 49 |
| 311 Holly Pl | 0.72mi | 3/2.0 | 1,368 (-7%) | 5mo | $179,900 | $132 | 49 |
| 653 Washington Ave | 0.65mi | 4/2.0 (+1) | 1,360 (-7%) | 4mo | $137,000 | $101 | 48 |
| 437 Erie St | 0.68mi | 4/1.0 (+1) | 1,344 (-8%) | 6mo | $147,000 | $109 | 42 |
Match score weights: distance 35% · size 25% · config 20% · recency 20%. Top-matched comps best support the ARV.
Projected returns pro-forma
-3.0% appreciation · 5.86% rent growth · sell at horizon
- IRR
- -19.3%
- Equity multiple
- 0.31×
- Total profit
- $-36,572
- Equity at exit
- $28,181
- IRR
- -7.1%
- Equity multiple
- 0.49×
- Total profit
- $-26,826
- Equity at exit
- $16,341
Cash invested: $52,920 (down + closing). Projections, not guarantees.
Landlord ↔ Tenant lean methodology
- Overall (STATE)
- 73 Landlord-Friendly
- State Ohio
- 73 Landlord-Friendly · R+6
- County
- — inherits STATE
- City
- — inherits STATE
ZIP-level market 44203
- Rents YoY
- 5.9%
- Active inventory
- 226
- Price-to-rent
- 11.3×
Monthly cashflow live
- Estimated rent
- $1,399 high interval (Pro) →
- Mortgage (P&I)
- −$991
- Tax from tax record
- −$194 /mo · $2,327/yr
- Insurance
- −$79
- HOA
- −$0
- Vacancy / Maint / Mgmt
- −$294
- Net cashflow
- $-158
Break-even live
Sensitivity live
| Price | -10% $-51 | -5% $-105 | +0% $-158 | +5% $-212 | +10% $-265 |
|---|---|---|---|---|---|
| Rent | -10% $-269 | -5% $-214 | +0% $-158 | +5% $-103 | +10% $-48 |
| Rate | -1.0pp $-63 | -0.5pp $-110 | base $-158 | +0.5pp $-207 | +1.0pp $-257 |
UW: 25.0% down · 7.5% · 30yr · 1.5% tax · 5.0% vac · 8.0% maint · 8.0% mgmt
Financing live
Cash to close
- Down payment
- $47,250
- Closing costs
- $5,670
- Reserves months
- —
- Total cash needed
- —
Loan-product check · same deal, 3 products live
Conventional
25% down · 7.5% · 30yr
- Down + closing
- —
- Monthly P&I
- —
- Monthly cashflow
- —
- DSCR
- —
- Eligible?
- —
Personal DTI + credit; lowest rate.
DSCR
20% down · 8.5% · 30yr
- Down + closing
- —
- Monthly P&I
- —
- Monthly cashflow
- —
- DSCR
- —
- Eligible?
- —
No personal income docs; deal must DSCR.
Hard money
10% down · 12.0% · 12mo
- Down + closing
- —
- Monthly P&I
- —
- Monthly cashflow
- —
- DSCR
- —
- Eligible?
- —
Short-term bridge; refi at stabilization.
Rent comps 7 comps
| Address | Beds | Baths | Sqft | Rent | $/sqft | DOM | Units | Dist |
|---|---|---|---|---|---|---|---|---|
| 617 Robinson Ave Barberton, OH | 2.0 | 1.0 | 1140 | $995 | $0.87 | 16d | 1 | 0.55mi |
| 459 Wooster Rd N Unit 469 Barberton, OH | 3.0 | 1.0 | 1782 | $1,000 | $0.56 | 45d | 1 | 0.60mi |
| 653 Washington Ave Barberton, OH | 4.0 | 2.0 | 1360 | $1,600 | $1.18 | 23d | 1 | 0.67mi |
| 543 Otterbein Ave Barberton, OH | 4.0 | 1.0 | 1100 | $1,500 | $1.36 | 16d | 1 | 0.92mi |
| 149 2nd St SW Unit 149 Barberton, OH | 2.0 | 1.0 | 1037 | $1,100 | $1.06 | 16d | 1 | 0.96mi |
| 667 W Park Ave Barberton, OH | 2.0 | 1.0 | 900 | $1,350 | $1.50 | 16d | 1 | 1.10mi |
| 200 8th St NW Barberton, OH | 3.0 | 2.0 | 1144 | $1,550 | $1.35 | 16d | 1 | 1.16mi |
Listing history 11 events
-
2026-05-18status Pending 1040-char remark
-
2026-05-13$189,000 Active 1040-char remark
-
2008-06-11soldstatus $94,000 248-char remark
Show marketing remark (248 chars)
Beautiful updated brick colonial w/ newer kitchen, wood floors, updated roof, furnace, HWT & gutters * woodburning fireplace * Nice size family room * Great yard * Freshly painted * 1/2 bath * Close to Hospital, shopping & park!!
-
2008-02-01$99,900 248-char remark
Show marketing remark (248 chars)
Beautiful updated brick colonial w/ newer kitchen, wood floors, updated roof, furnace, HWT & gutters * woodburning fireplace * Nice size family room * Great yard * Freshly painted * 1/2 bath * Close to Hospital, shopping & park!!
-
2007-04-25historical
-
2006-10-25historical
-
2006-10-25$109,900
-
2006-08-09$119,900
-
2006-05-24soldstatus $66,200
-
2006-04-20soldstatus $66,200
-
2006-02-28$84,900
ⓘ Source: listings_history table (triggers on properties + properties_extension) + one-shot
backfill from property_details.listing_events for pre-trigger history.
Tax reassessment forecast OH · Partial reset (capped growth)
- Current annual tax
- $2,327 · $194/mo
- Projected year-2 tax
- $2,638 · $220/mo
- Expected delta
- +$310/yr (+$26/mo · 13.3%)
ⓘ Screening estimate from a state-policy table — verify with the county assessor before closing.
Climate risk First Street
- Flood 1/10 Low FEMA zone X (unshaded) · 0% chance over 30 yrs
- Wildfire 1/10 Low
- Heat 3/10 Moderate 7 d/yr ≥96°F today · 17 d/yr by 30 yrs out
- Wind 1/10 Low
- Air quality 2/10 Low 0 unhealthy d/yr today · 1 by 30 yrs out
Nearby sold comps map
Loading sold comps map…
Walkable amenities ~0.75 mi
Loading nearby amenities…
Taxation est. · year 1
- Rental income
- $16,793
- − Mortgage interest
- −$10,587
- − Property taxes
- −$2,327
- − Insurance
- −$945
- − Repairs & maintenance
- −$1,343
- − Management
- −$1,343
- − Depreciation
- −$5,498
- Taxable loss
- −$5,252
- Est. tax savings @ 24.0%
- +$1,260
- After-tax cash flow
- $-639/yr
For passive investors: Depreciation is non-cash, so a rental often shows a tax loss while cash-flowing — sheltering income. Rental losses are passive: they offset passive income freely, and up to $25,000/yr can offset ordinary (W-2) income if you actively participate and your MAGI is under $100k (phasing out to $0 by $150k); unused losses carry forward. On sale, claimed depreciation is recaptured at up to 25%, and gains may owe capital-gains tax (a 1031 exchange can defer both). Figures are a year-1 estimate at your 24.0% rate — not tax advice; consult a CPA.
Schools (NCES district)
- District
- Barberton City
- NCES district ID
- 3904353
- Math proficiency
- 47% ▼ -9.00%
- Reading proficiency
- 51% ▼ -9.00%
- Median HH income
- $37,660
- Composite
- 40.77/100
- National rank
- #3646
- State rank
- #466 of 656 in OH
Livability — Barberton
- Score
- 71/100
- State rank
- #428
- US rank
- #7016
Category grades
Schools grade is shown separately in the Schools card above.
Census & demographics
- Census place
- Barberton, OH
- County
- Summit County · 440,783 people
- City population
- 38,701
- Metro
- Akron, OH
- Population (ZIP)
- 38,701
- Household income
- $63,759
- Rent vs Own
- Severe rent burden
- 805.0
Population outlook (Summit County) Hauer SSP2
- Today (2025)
- 546,583 people
- By 2030
- 544,028 · -0.5%
- By 2040
- 531,363 · -2.8%
- By 2050
- 514,923 · -5.8%
- By 2075
- 481,765 · -11.9%
- By 2100
- 432,265 · -20.9%
Race, ethnicity, and origin ACS 2023
- Neighborhood character
- Predominantly White (86%)
- Race & ethnicity
- White 86% Black 7% Two or more races 5% Hispanic / Latino 1%
- Common ancestry
- Romanian 3% Slovak 2% Italian 1%
- Foreign-born
- 2% · Canada
- Languages at home
- 97% English-only · Russian/Polish/Slavic 1% Spanish 1%
Political lean MEDSL · Summit
- 2024 margin
- Lean D (+7.0) · D 53.0% · R 46.0%
- 2008→2024 swing
- -9.6pp toward R · 2008: 16.6pp · 2024: 7.0pp
- All cycles
- 2024: D+7.0 2020: D+9.6 2016: D+8.2 2012: D+14.8 2008: D+16.6
Not yet ingested
- Civics
- —
Market trends
- HPI YoY
- ▼ -224.82%
- Current HPI
- 199.8143
- Rent YoY
- ▲ 5.86%
- Metro
- Akron, OH
- State GDP YoY
- ▲ 1.98%
- F500 in state
- 48
Industry mix (Fortune 500 HQ in OH)
| Industry | F500 HQs | Revenue |
|---|---|---|
| Insurance | 3 | $145B |
|
||
| Industrial Machinery | 3 | $49B |
|
||
| Financial Services | 3 | $24B |
|
||
| Consumer Goods | 2 | $93B |
|
||
| Aerospace / Defense | 2 | $47B |
|
||
| Utilities | 2 | $33B |
|
||
Price history
+122.6% since first listed11 events — show timeline
- 2026-05-18 Pending — MLSNOW
- 2026-05-13 Listed $189,000 MLSNOW
- 2008-06-11 Sold (MLS) $94,000 MLSNOW
- 2008-02-01 Listed $99,900 MLSNOW
- 2007-04-25 Listing Removed — MLSNOW
- 2006-10-25 Listed $109,900 MLSNOW
- 2006-10-25 Listing Removed — MLSNOW
- 2006-08-09 Listed $119,900 MLSNOW
- 2006-05-24 Sold (MLS) $66,200 MLSNOW
- 2006-04-20 Sold (Public Records) $66,200 Public Records
- 2006-02-28 Listed $84,900 MLSNOW
Property tax history
+1.9%/yrLatest (2025): $2,327 · -2.1% YoY. Source: county tax records.
Cash-flow waterfall
monthlySold comps — $/sqft
last 12 mo · ≤1 miLoading sold comps…