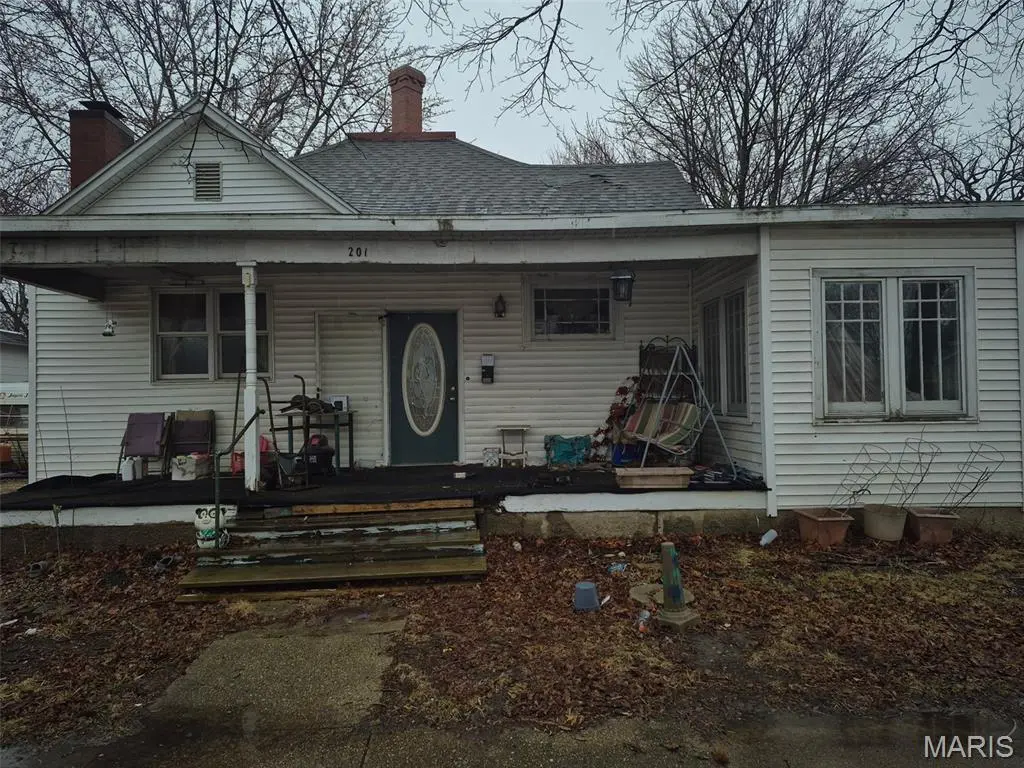
201 W North 4th St
Shelbyville, IL 62565
$11,900D
3 bd · 1.0 ba ·
1,564 sqft ·
Built 1965
· Other
· Pending
· 8 DOM
Cashflow @ list (25.0% down · 7.5%)
Estimated rent
$1,108/mo
Mortgage (P&I)
−$62
Tax + insurance
−$20
HOA
−$0
Vac / Maint / Mgmt
−$233
Net cashflow
$793/mo
Annual
$9,518/yr
Cap rate
86.27%
Cash-on-cash
285.65%
DSCR
13.71
1% rule
9.31%
Cash to close
$3,332
Investor read
- This is a 3-bed/1.0-bath other listed at $12k.
- At list price, monthly cash flow is $793 ($10k/yr) — positive.
- The deal already cash-flows at list — no discount required.
- Meets the 1% rule at list price ($1k rent vs $12k).
- Only 8 days on market — expect competitive offers; lowballing is unlikely to land.
- Local home prices are declining (-3.0%/yr); year-one equity from $82 of loan paydown is wiped out by about $357 of value loss. Plan a longer hold.
- Location reads 70/100 on livability (#355 in IL) — a middle-class / working-renter tenant base. Strengths: crime A+, cost of living A+, housing A+; Watch: employment D+, amenities F, commute F.
- Shelbyville CUSD 4 (town): math 25% / reading 41% proficiency, ranked #225 of 620 in IL (top 36%) — families likely to look elsewhere, expect single-tenant / working-renter base with shorter leases.
- Zoned schools: Shelbyville High School (math 17% / reading 22%, grade F, #397 of 693 statewide, top 61%, 354 students, 0% FRL) — zoned schools average 0% FRL vs 38% district-wide (38 pts lower); this property's tenant base skews higher-income than the district average.
- Zoned-school proficiency averages 20% at this address vs 33% district-wide (-14 pts) — the specific schools serving this property underperform the Shelbyville CUSD 4 average; the district grade overstates school quality for this exact location.
- Market conditions: 53 active listings in the ZIP; 41 units permitted in Shelby County in 2024 (0 in 5+ unit buildings).
- Shelby County population projected at -22% by 2050 — secular population decline; favor cash flow + early exit over multi-decade hold.
- 3 sale attempts since 14y ago with the ask held roughly flat each time — persistent listings suggest the price (not the market) is what's stuck; bring a comps-based counter.
- At projected returns (-3.0% appreciation + 3.0% rent growth), your $3k cash investment doubles in ~1 year — after that, you're playing with house money.
- Cap rate 86.3% vs local median 5.0% in Shelbyville — top-decile yield for the area; either an underpriced asset or a hidden risk that comps aren't pricing in. Stress-test before assuming the spread holds.
Questions for listing agent
- Built in 1965 — when were the roof, HVAC, electrical panel, plumbing, and water heater last replaced?
- Is there a deadline driving the sale (1031 exchange, divorce, estate, relocation)? That informs how much negotiation room exists.
- The area grade is low — what's the realistic commute time and amenity access for the typical tenant pool here? Any planned neighborhood developments (good or bad) we should know about?
- What's the average days-on-market for RENTAL listings here right now (not sales)? A rising rental-DOM trend means longer vacancies and softer asking-rent achievability than the comps imply.
- What's the recent tenant-quality profile in this submarket — average credit score on applications, eviction rate, late-payment / NSF rate, and stable-employment percentage? A property-management company in the area should have these aggregated.
- How much new for-sale + rental construction is in the pipeline within 1–3 miles? Heavy new supply typically softens prices + rents 12–24 months out; constrained supply supports both.
CashFlowRE · CFR-5HHPT0CDD7D4WF
· Data 2 weeks ago
cashflowre.app · 2026-05-29