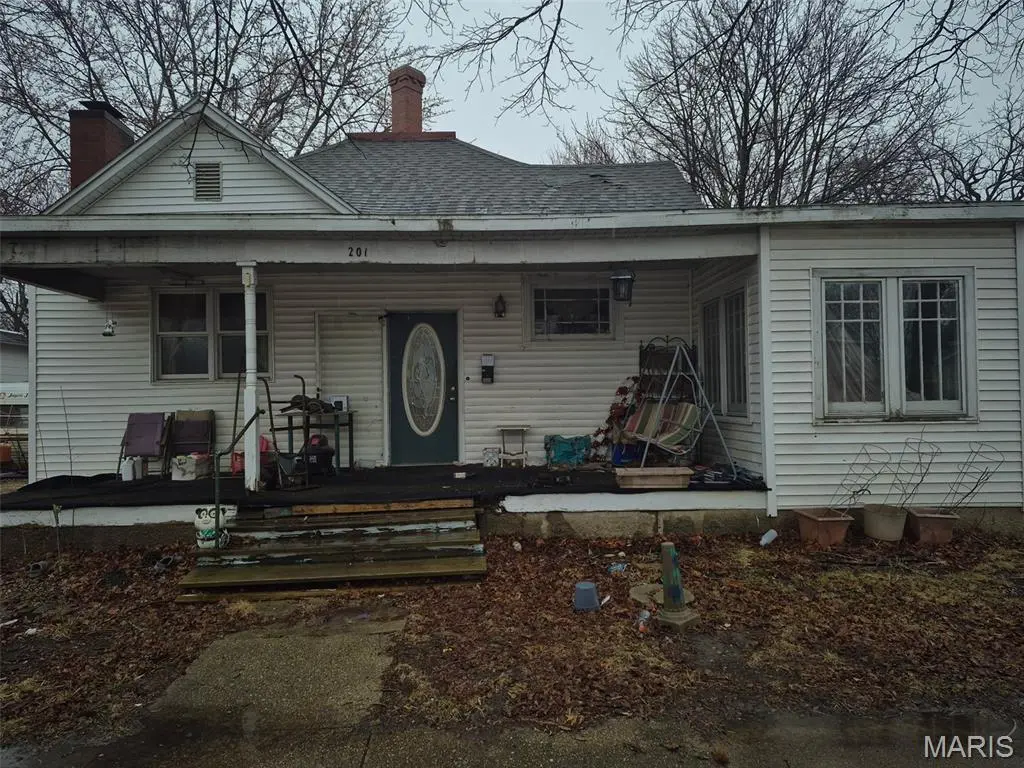
201 W North 4th St · Shelbyville, IL
Flood risk 1/10 · Minimal
- FEMA flood zone
- —
- Chance of flooding over 30 yrs
- 0.0%
- Est. flood insurance / yr
- —
Fire risk 3/10 · Minor
- Est. fire insurance / yr
- $804 – $1,492
Heat risk 4/10 · Minor
- Hot days now (above 105°F)
- 7 days/yr
- Hot days in 30 yrs
- 20 days/yr
Wind risk 2/10 · Minimal
- Chance of severe wind over 30 yrs
- 2.0%
Air-quality risk 2/10 · Minimal
- Unhealthy air days now
- 1 days/yr
- Unhealthy air days in 30 yrs
- 2 days/yr
Risk factors via First Street. Map © Google.
Why this score? — see what drove the D grade
The composite is a weighted blend of 9 inputs, each scored 0–100. Each bar is that input's sub-score; the figure is the points it added to the 100-point composite (weight × sub-score).
- Cash flow +15.0/30.0
- ARV discount +7.5/15.0
- 1% rule +5.0/10.0
- DSCR +5.0/10.0
- Livability +3.5/5.0
- Schools +2.8/10.0
- Rent growth +2.5/5.0
- Condition / age +2.5/5.0
- Appreciation +0.0/10.0
$11,900
🖨 Deal sheet 📄 Offer letter ✓ Due diligence
Listing remarks MLS
Looking for a "fixer-upper"? This 3 bedroom home on corner lot has potential! Large living room, fireplace and sun room. BEING SOLD "AS IS"
Key facts
- 5,842 sq ft lot
- Built 1965
- Listed 8 days
Neighborhood map
What this means for you Summary
Snapshot
- This is a 3-bed/1.0-bath other listed at $12k.
Deal economics
- At list price, monthly cash flow is $793 ($10k/yr) — positive.
- The deal already cash-flows at list — no discount required.
- Meets the 1% rule at list price ($1k rent vs $12k).
- Cap rate 86.3% vs local median 5.0% in Shelbyville — top-decile yield for the area; either an underpriced asset or a hidden risk that comps aren't pricing in. Stress-test before assuming the spread holds.
Location & tenants
- Location reads 70/100 on livability (#355 in IL) — a middle-class / working-renter tenant base. Strengths: crime A+, cost of living A+, housing A+; Watch: employment D+, amenities F, commute F.
- Shelbyville CUSD 4 (town): math 25% / reading 41% proficiency, ranked #225 of 620 in IL (top 36%) — families likely to look elsewhere, expect single-tenant / working-renter base with shorter leases.
- Zoned schools: Shelbyville High School (math 17% / reading 22%, grade F, #397 of 693 statewide, top 61%, 354 students, 0% FRL) — zoned schools average 0% FRL vs 38% district-wide (38 pts lower); this property's tenant base skews higher-income than the district average.
- Zoned-school proficiency averages 20% at this address vs 33% district-wide (-14 pts) — the specific schools serving this property underperform the Shelbyville CUSD 4 average; the district grade overstates school quality for this exact location.
- Market conditions: 53 active listings in the ZIP; 41 units permitted in Shelby County in 2024 (0 in 5+ unit buildings).
Forward outlook
- Local home prices are declining (-3.0%/yr); year-one equity from $82 of loan paydown is wiped out by about $357 of value loss. Plan a longer hold.
- Shelby County population projected at -22% by 2050 — secular population decline; favor cash flow + early exit over multi-decade hold.
- At projected returns (-3.0% appreciation + 3.0% rent growth), your $3k cash investment doubles in ~1 year — after that, you're playing with house money.
Negotiation context
- Only 8 days on market — expect competitive offers; lowballing is unlikely to land.
- 3 sale attempts since 14y ago with the ask held roughly flat each time — persistent listings suggest the price (not the market) is what's stuck; bring a comps-based counter.
Questions for the listing agent
- Built in 1965 — when were the roof, HVAC, electrical panel, plumbing, and water heater last replaced?
- Is there a deadline driving the sale (1031 exchange, divorce, estate, relocation)? That informs how much negotiation room exists.
- The area grade is low — what's the realistic commute time and amenity access for the typical tenant pool here? Any planned neighborhood developments (good or bad) we should know about?
- What's the average days-on-market for RENTAL listings here right now (not sales)? A rising rental-DOM trend means longer vacancies and softer asking-rent achievability than the comps imply.
- What's the recent tenant-quality profile in this submarket — average credit score on applications, eviction rate, late-payment / NSF rate, and stable-employment percentage? A property-management company in the area should have these aggregated.
- How much new for-sale + rental construction is in the pipeline within 1–3 miles? Heavy new supply typically softens prices + rents 12–24 months out; constrained supply supports both.
Investment metrics
- 1% rule
- 9.31% ✓
- Cap rate
- 86.27%
- Cash-on-cash
- 285.65%
- DSCR
- 13.71
- GRM
- 0.9
CMA / ARV
No comps found within radius.
Projected returns pro-forma
-3.0% appreciation · 3.0% rent growth · sell at horizon
- IRR
- —
- Equity multiple
- 15.59×
- Total profit
- $48,605
- Equity at exit
- $1,774
- IRR
- —
- Equity multiple
- 33.24×
- Total profit
- $107,440
- Equity at exit
- $1,029
Cash invested: $3,332 (down + closing). Projections, not guarantees.
Landlord ↔ Tenant lean methodology
- Overall (STATE)
- 43 Moderately Tenant-Leaning
- State Illinois
- 43 Moderately Tenant-Leaning · D+7
- County
- — inherits STATE
- City
- — inherits STATE
ZIP-level market 62565
- Home prices YoY
- -11.6%
- Active inventory
- 53
- Price-to-rent
- 0.9×
Monthly cashflow live
- Estimated rent
- $1,108 medium interval (Pro) →
- Mortgage (P&I)
- −$62
- Tax est. 1.5%
- −$15 /mo · $178/yr
- Insurance
- −$5
- HOA
- −$0
- Vacancy / Maint / Mgmt
- −$233
- Net cashflow
- $793
Break-even live
UW: 25.0% down · 7.5% · 30yr · 1.5% tax · 5.0% vac · 8.0% maint · 8.0% mgmt
Financing live
Cash to close
- Down payment
- $2,975
- Closing costs
- $357
- Reserves months
- —
- Total cash needed
- —
Loan-product check · same deal, 3 products live
Conventional
25% down · 7.5% · 30yr
- Down + closing
- —
- Monthly P&I
- —
- Monthly cashflow
- —
- DSCR
- —
- Eligible?
- —
Personal DTI + credit; lowest rate.
DSCR
20% down · 8.5% · 30yr
- Down + closing
- —
- Monthly P&I
- —
- Monthly cashflow
- —
- DSCR
- —
- Eligible?
- —
No personal income docs; deal must DSCR.
Hard money
10% down · 12.0% · 12mo
- Down + closing
- —
- Monthly P&I
- —
- Monthly cashflow
- —
- DSCR
- —
- Eligible?
- —
Short-term bridge; refi at stabilization.
Listing history 7 events
-
2026-04-22status Pending
-
2026-04-14$11,900 Active
-
2012-12-20soldstatus 177-char remark
Show marketing remark (161 chars)
Looking for a "fixer-upper"? This 3 bedroom home on corner lot has potential! Large living room, fireplace and sun room. BEING SOLD "AS IS"
-
2012-12-20soldstatus 161-char remark
Show marketing remark (161 chars)
Looking for a "fixer-upper"? This 3 bedroom home on corner lot has potential! Large living room, fireplace and sun room. BEING SOLD "AS IS"
-
2012-06-14$39,600 177-char remark
Show marketing remark (161 chars)
Looking for a "fixer-upper"? This 3 bedroom home on corner lot has potential! Large living room, fireplace and sun room. BEING SOLD "AS IS"
-
2012-06-14$39,600 161-char remark
Show marketing remark (161 chars)
Looking for a "fixer-upper"? This 3 bedroom home on corner lot has potential! Large living room, fireplace and sun room. BEING SOLD "AS IS"
-
2004-08-11soldstatus $23,000
ⓘ Source: listings_history table (triggers on properties + properties_extension) + one-shot
backfill from property_details.listing_events for pre-trigger history.
Climate risk First Street
- Flood 1/10 Low 0% chance over 30 yrs
- Wildfire 3/10 Moderate
- Heat 4/10 Moderate 7 d/yr ≥105°F today · 20 d/yr by 30 yrs out
- Wind 2/10 Low 2% chance of damaging wind over 30 yrs
- Air quality 2/10 Low 1 unhealthy d/yr today · 2 by 30 yrs out
Nearby sold comps map
Loading sold comps map…
Walkable amenities ~0.75 mi
Loading nearby amenities…
Taxation est. · year 1
- Rental income
- $13,297
- − Mortgage interest
- −$667
- − Property taxes
- −$178
- − Insurance
- −$60
- − Repairs & maintenance
- −$1,064
- − Management
- −$1,064
- − Depreciation
- −$346
- Taxable income
- $9,919
- Est. tax owed @ 24.0%
- −$2,381
- After-tax cash flow
- $7,137/yr
For passive investors: Depreciation is non-cash, so a rental often shows a tax loss while cash-flowing — sheltering income. Rental losses are passive: they offset passive income freely, and up to $25,000/yr can offset ordinary (W-2) income if you actively participate and your MAGI is under $100k (phasing out to $0 by $150k); unused losses carry forward. On sale, claimed depreciation is recaptured at up to 25%, and gains may owe capital-gains tax (a 1031 exchange can defer both). Figures are a year-1 estimate at your 24.0% rate — not tax advice; consult a CPA.
Schools (NCES district)
- District
- Shelbyville CUSD 4
- NCES district ID
- 1736090
- Math proficiency
- 25% ▼ -10.00%
- Reading proficiency
- 41% ▼ -12.00%
- Median HH income
- $44,461
- Composite
- 28.1/100
- National rank
- #6827
- State rank
- #225 of 620 in IL
Livability — Shelbyville
- Score
- 70/100
- State rank
- #355
- US rank
- #7321
Category grades
Schools grade is shown separately in the Schools card above.
Census & demographics
- Census place
- Shelbyville, IL
- City population
- 7,422
- Population (ZIP)
- 7,422
Population outlook (Shelby County) Hauer SSP2
- Today (2025)
- 20,512 people
- By 2030
- 19,675 · -4.1%
- By 2040
- 17,851 · -13.0%
- By 2050
- 15,973 · -22.1%
- By 2075
- 11,799 · -42.5%
- By 2100
- 8,030 · -60.9%
Race, ethnicity, and origin ACS 2023
- Neighborhood character
- Predominantly White (97%)
- Race & ethnicity
- White 97% Two or more races 2%
- Common ancestry
- Lithuanian 4% Romanian 3% Slovak 2%
- Foreign-born
- 2% · Canada, South Korea
- Languages at home
- 97% English-only · Russian/Polish/Slavic 2% Spanish 1%
Political lean MEDSL · Shelby
- 2024 margin
- Solid R (+60.2) · D 19.2% · R 79.5% · Other 1.4%
- 2008→2024 swing
- -40.5pp toward R · 2008: -19.8pp · 2024: -60.2pp
- All cycles
- 2024: R+60.2 2020: R+57.2 2016: R+54.3 2012: R+33.7 2008: R+19.8
Not yet ingested
- Civics
- —
Market trends
- HPI YoY
- ▼ -23.35%
- Current HPI
- 178.3002
- Rent YoY
- —
- Metro
- —
- State GDP YoY
- ▲ 1.59%
- F500 in state
- 60
Industry mix (Fortune 500 HQ in IL)
| Industry | F500 HQs | Revenue |
|---|---|---|
| Insurance | 4 | $201B |
|
||
| Consumer Goods | 4 | $87B |
|
||
| Industrial Machinery | 3 | $64B |
|
||
| Healthcare | 2 | $55B |
|
||
| Retail / Pharmacy | 1 | $148B |
|
||
| Agriculture / Food | 1 | $86B |
|
||
Price history
-48.3% since first listed7 events — show timeline
- 2026-04-22 Pending — MARIS as Distributed by MLS Grid
- 2026-04-14 Listed $11,900 MARIS as Distributed by MLS Grid
- 2012-12-20 Sold (MLS) — CIBR
- 2012-12-20 Sold (MLS) — MRED as Distributed by MLS Grid
- 2012-06-14 Listed $39,600 CIBR
- 2012-06-14 Listed $39,600 MRED as Distributed by MLS Grid
- 2004-08-11 Sold (Public Records) $23,000 Public Records
Property tax history
+4.2%/yrLatest (2024): $991 · +3.8% YoY. Source: county tax records.
Cash-flow waterfall
monthlySold comps — $/sqft
last 12 mo · ≤1 miLoading sold comps…