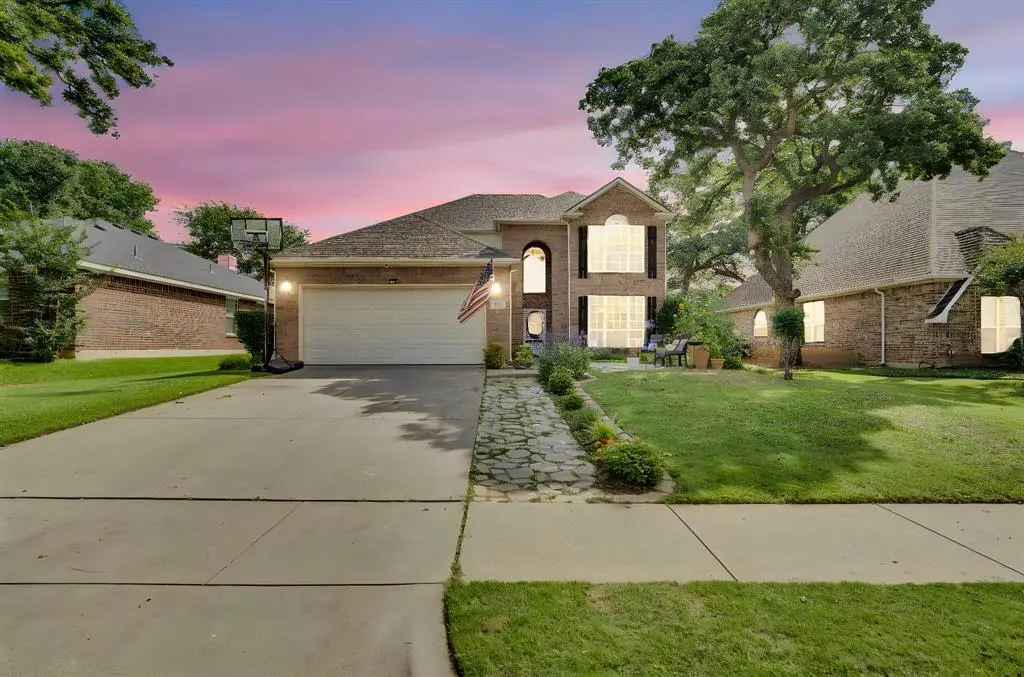
517 Crawford Dr
Burleson, TX 76028
$420,000B-
4 bd · 2.0 ba ·
2,744 sqft ·
Built 2000
· SingleFamily
· Active
· 19 DOM
Cashflow @ list (25.0% down · 7.5%)
Estimated rent
$5,084/mo
Mortgage (P&I)
−$2,203
Tax + insurance
−$888
HOA
−$45
Vac / Maint / Mgmt
−$1,068
Net cashflow
$881/mo
Annual
$10,574/yr
Cap rate
8.81%
Cash-on-cash
8.99%
DSCR
1.40
1% rule
1.21%
Cash to close
$117,600
Investor read
- This is a 4-bed/2.0-bath single-family listed at $420k.
- At list price, monthly cash flow is $881 ($11k/yr) — positive.
- The deal already cash-flows at list — no discount required.
- Meets the 1% rule at list price ($5k rent vs $420k).
- It's been on market 19 days — a 2% lower offer ($414k) is reasonable based on typical stale-listing flexibility.
- Recommended offer: $414k (1.5% below list) — sets the bar for market timing.
- Local home prices are declining (-3.0%/yr); year-one equity from $3k of loan paydown is wiped out by about $13k of value loss. Plan a longer hold.
- Location reads 79/100 on livability (#53 in TX, #2,133 nationally) — a middle-class / working-renter tenant base. Strengths: employment A+, cost of living A+, housing A+; Watch: amenities F, commute F.
- Joshua ISD (rural): math 52% / reading 50% proficiency, ranked #139 of 826 in TX (top 17%) — acceptable for families but not a draw, mixed tenant base, ~2y average lease.
- Zoned schools: North Joshua El (math 66% / reading 69%, grade B+, #189 of 4,322 statewide, top 5%, 683 students, 28% FRL); R C Loflin Middle (math 41% / reading 45%, grade D-, #540 of 1,662 statewide, top 33%, 730 students, 55% FRL); Joshua H S (math 67% / reading 15%, grade F, #774 of 1,632 statewide, top 49%, 1,242 students, 44% FRL) — zoned schools at 42% FRL track the district average.
- Market conditions: Rents rising (+1.8%/yr); 684 active listings in the ZIP; 5 comparable units currently listed for rent nearby; rentals at typical pace (median 24d on market — plan ~3-4 weeks tenant-placement turnaround); solid renter incomes; 2,152 units permitted in Johnson County in 2024 (76 in 5+ unit buildings).
- Johnson County population projected at +24% by 2050 — long-run rental-demand tailwind backs the buy-and-hold thesis.
- 3 sale attempts since 10y ago with the ask held roughly flat each time — persistent listings suggest the price (not the market) is what's stuck; bring a comps-based counter.
- Climate carrying-cost: major wind risk, 27% chance of damaging wind over 30y; extreme-heat days projected 7→26/yr by 2055 (HVAC capex compounding) — expect insurance premiums to compound above CPI over the hold.
- Cap rate 8.8% vs local median 3.5% in Burleson — top-decile yield for the area; either an underpriced asset or a hidden risk that comps aren't pricing in. Stress-test before assuming the spread holds.
- At $5,084/mo this rent would consume 60% of the median local household income ($101k/yr) (locally 1117% of renters already pay >50% of income on rent) — very limited rent-growth headroom before tenants either downsize or default.
Questions for listing agent
- What does the HOA fee cover, when was the last increase, and are there any pending special assessments or reserve-fund shortfalls?
- Is there a deadline driving the sale (1031 exchange, divorce, estate, relocation)? That informs how much negotiation room exists.
- What's the average days-on-market for RENTAL listings here right now (not sales)? A rising rental-DOM trend means longer vacancies and softer asking-rent achievability than the comps imply.
- What's the recent tenant-quality profile in this submarket — average credit score on applications, eviction rate, late-payment / NSF rate, and stable-employment percentage? A property-management company in the area should have these aggregated.
- How much new for-sale + rental construction is in the pipeline within 1–3 miles? Heavy new supply typically softens prices + rents 12–24 months out; constrained supply supports both.
CashFlowRE · CFR-5M1FZ24VJ1S47D
· Data 16 h ago
cashflowre.app · 2026-05-29