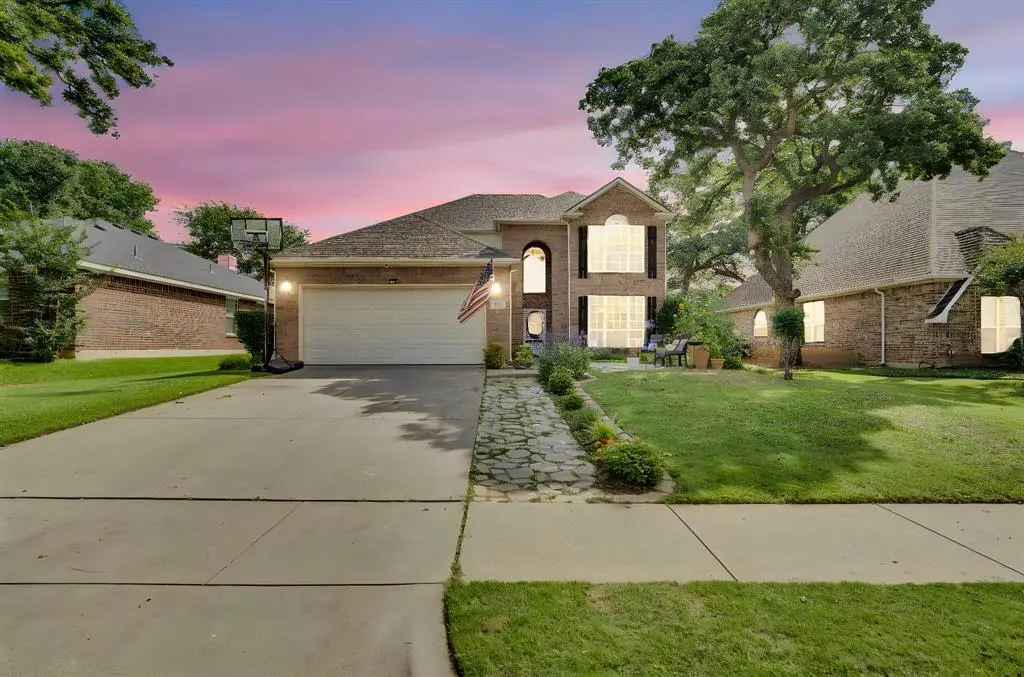
517 Crawford Dr · Burleson, TX
Flood risk 1/10 · Minimal
- FEMA flood zone
- X (unshaded)
- Chance of flooding over 30 yrs
- 0.0%
- Est. flood insurance / yr
- $507 – $1,088
Fire risk 4/10 · Minor
- Est. fire insurance / yr
- $1,222 – $2,270
Heat risk 7/10 · Major
- Hot days now (above 109°F)
- 7 days/yr
- Hot days in 30 yrs
- 26 days/yr
Wind risk 6/10 · Moderate
- Chance of severe wind over 30 yrs
- 27.0%
Air-quality risk 2/10 · Minimal
- Unhealthy air days now
- 1 days/yr
- Unhealthy air days in 30 yrs
- 2 days/yr
Risk factors via First Street. Map © Google.
Why this score? — see what drove the B- grade
The composite is a weighted blend of 9 inputs, each scored 0–100. Each bar is that input's sub-score; the figure is the points it added to the 100-point composite (weight × sub-score).
- Cash flow +24.7/30.0
- ARV discount +13.8/15.0
- DSCR +8.0/10.0
- 1% rule +7.1/10.0
- Schools +4.5/10.0
- Livability +4.0/5.0
- Rent growth +2.9/5.0
- Condition / age +2.5/5.0
- Appreciation +0.0/10.0
$420,000
🖨 Deal sheet (PDF) 📄 Offer letter ✓ Due diligence
Listing remarks MLS
Wonderful 5 bedroom home ready for new owners located in Joshua ISD! Immaculate curb appeal includes pristine landscaping & a lovely patio area to be enjoyed under the cool shade trees. The main living area is open concept & boasts hard surface flooring & crown molding details. The dark cabinetry in the kitchen is complemented nicely by the neutral granite counters & tile backsplash. You'll love the SS appliances, dual dining spaces & how it opens out to the family room. Main floor primary bedroom features a great view to the backyard & a lovely 5-piece ensuite complete with a double vanity, soaking tub & walk-in closet. Upstairs is home to brand new carpet, 4 bedrooms, a full bath & a generous loft that lends itself to being the perfect game room. The backyard offers an amazing patio extending the full length of the house, perfect for outdoor living or dining! Click the Virtual Tour link to view the 3D tour.
Key facts
- Formal dining room
- Two living areas
- Updated kitchen
Tags
Property features AI
Finance
- Other: Subdivision: Lakewood Ph Mt Valley 01 Country; GPS-friendly directions
- Financial info: Financing options: Cash, Conventional, FHA, VA
- HOA & community: Mandatory association; Association management fees included; Association fee $270 semi-annually; HOA managed by Goodwill and Company
Exterior
- Parking: 2 covered parking spaces; 2-car attached garage; Driveway; Garage door opener; Garage faces front; 2-car single garage door
- Security: Smoke detectors
- Utilities: City water; City sewer; Cable available; Standard power (electric)
- Home design: Single family residence; Two levels; Residential property; Preowned (built in 2000); Not attached to another property
- Construction: Brick and siding construction; Composition roof; Slab foundation; Year built 2000
- Exterior features: Covered patio; Wood fencing in back yard; All-weather road access; Alley and asphalt access; Curbs; Community mailbox
Interior
- Kitchen: Electric range; Microwave; Dishwasher; Disposal
- Bedrooms: 5 bedrooms; Primary bedroom on level 1 with ensuite bath, garden tub, separate shower, dual sinks and walk-in closet
- Flooring: Carpet; Ceramic tile; Tile
- Bathrooms: 2 full bathrooms; 1 half bathroom
- Heating & cooling: Central heating (electric); Central air (electric); Ceiling fans
- Interior features: Open floorplan; Vaulted ceilings; Granite counters; Eat-in kitchen; Pantry; Decorative lighting and chandelier; High-speed internet available; Walk-in closets
- Laundry & utility: Utility room with full-size washer/dryer area
Neighborhood map
What this means for you Summary
Snapshot
- This is a 4-bed/2.0-bath single-family listed at $420k.
Deal economics
- At list price, monthly cash flow is $881 ($11k/yr) — positive.
- The deal already cash-flows at list — no discount required.
- Meets the 1% rule at list price ($5k rent vs $420k).
- Recommended offer: $414k (1.5% below list) — sets the bar for market timing.
- Cap rate 8.8% vs local median 3.5% in Burleson — top-decile yield for the area; either an underpriced asset or a hidden risk that comps aren't pricing in. Stress-test before assuming the spread holds.
Location & tenants
- Location reads 79/100 on livability (#53 in TX, #2,133 nationally) — a middle-class / working-renter tenant base. Strengths: employment A+, cost of living A+, housing A+; Watch: amenities F, commute F.
- Joshua ISD (rural): math 52% / reading 50% proficiency, ranked #139 of 826 in TX (top 17%) — acceptable for families but not a draw, mixed tenant base, ~2y average lease.
- Market conditions: Rents rising (+1.8%/yr); 687 active listings in the ZIP; 5 comparable units currently listed for rent nearby; rentals at typical pace (median 23d on market — plan ~3-4 weeks tenant-placement turnaround); solid renter incomes; 2,152 units permitted in Johnson County in 2024 (76 in 5+ unit buildings).
- At $5,084/mo this rent would consume 60% of the median local household income ($101k/yr) (locally 1117% of renters already pay >50% of income on rent) — very limited rent-growth headroom before tenants either downsize or default.
Forward outlook
- Local home prices are declining (-3.0%/yr); year-one equity from $3k of loan paydown is wiped out by about $13k of value loss. Plan a longer hold.
- Johnson County population projected at +24% by 2050 — long-run rental-demand tailwind backs the buy-and-hold thesis.
Negotiation context
- It's been on market 19 days — a 2% lower offer ($414k) is reasonable based on typical stale-listing flexibility.
- 3 sale attempts since 10y ago with the ask held roughly flat each time — persistent listings suggest the price (not the market) is what's stuck; bring a comps-based counter.
Risks & watch-outs
- Climate carrying-cost: major wind risk, 27% chance of damaging wind over 30y; extreme-heat days projected 7→26/yr by 2055 (HVAC capex compounding) — expect insurance premiums to compound above CPI over the hold.
Questions for the listing agent
- What does the HOA fee cover, when was the last increase, and are there any pending special assessments or reserve-fund shortfalls?
- Is there a deadline driving the sale (1031 exchange, divorce, estate, relocation)? That informs how much negotiation room exists.
- What's the average days-on-market for RENTAL listings here right now (not sales)? A rising rental-DOM trend means longer vacancies and softer asking-rent achievability than the comps imply.
- What's the recent tenant-quality profile in this submarket — average credit score on applications, eviction rate, late-payment / NSF rate, and stable-employment percentage? A property-management company in the area should have these aggregated.
- How much new for-sale + rental construction is in the pipeline within 1–3 miles? Heavy new supply typically softens prices + rents 12–24 months out; constrained supply supports both.
Investment metrics
- 1% rule
- 1.21% ✓
- Cap rate
- 8.81%
- Cash-on-cash
- 8.99%
- DSCR
- 1.40
- GRM
- 6.9
CMA / ARV
- ARV (on-the-fly)
- $488,432
- Comps found
- 12
Show comp detail 12 sales within ~0.75 mi
| Address | Dist | Beds/Ba | Sqft | Sold | Price | $/sf | Match |
|---|---|---|---|---|---|---|---|
| 2605 Steve St | 0.52mi | 4/2.5 | 2,589 (-6%) | 5mo | $474,900 | $183 | 60 |
| 217 Hawks Ridge Trl | 0.51mi | 4/2.0 | 2,453 (-11%) | 0mo | $435,000 | $177 | 58 |
| 305 Aurora Hills Trl | 0.47mi | 4/3.0 | 2,527 (-8%) | 4mo | $449,900 | $178 | 58 |
| 2613 Lee St | 0.61mi | 4/3.0 | 2,646 (-4%) | 6mo | $499,900 | $189 | 57 |
| 2605 Lila St | 0.46mi | 5/4.0 (+1) | 2,873 (+5%) | 3mo | $524,900 | $183 | 55 |
| 328 Alina St | 0.57mi | 3/2.5 (-1) | 2,589 (-6%) | 3mo | $484,990 | $187 | 55 |
| 2739 Chimney Rock Rd | 0.51mi | 4/2.5 | 3,034 (+11%) | 3mo | $523,500 | $173 | 54 |
| 2636 Lila St | 0.51mi | 3/3.0 (-1) | 2,527 (-8%) | 1mo | $499,900 | $198 | 53 |
| 200 Hawks Ridge Trl | 0.46mi | 4/2.5 | 2,384 (-13%) | 3mo | $398,000 | $167 | 52 |
| 300 Ben Thomas St | 0.55mi | 4/2.5 | 3,118 (+14%) | 1mo | $449,999 | $144 | 48 |
| 2609 Steve St | 0.52mi | 4/3.5 | 3,124 (+14%) | 0mo | $549,900 | $176 | 46 |
| 320 Ben Thomas St | 0.60mi | 4/2.0 | 2,336 (-15%) | 4mo | $415,000 | $178 | 44 |
Match score weights: distance 35% · size 25% · config 20% · recency 20%. Top-matched comps best support the ARV.
Projected returns pro-forma
-3.0% appreciation · 1.78% rent growth · sell at horizon
- IRR
- -4.1%
- Equity multiple
- 0.85×
- Total profit
- $-17,885
- Equity at exit
- $62,623
- IRR
- 4.1%
- Equity multiple
- 1.28×
- Total profit
- $32,892
- Equity at exit
- $36,314
Cash invested: $117,600 (down + closing). Projections, not guarantees.
Landlord ↔ Tenant lean methodology
- Overall (STATE)
- 87 Strongly Landlord-Friendly
- State Texas
- 87 Strongly Landlord-Friendly · R+5
- County
- — inherits STATE
- City
- — inherits STATE
ZIP-level market 76028
- Home prices YoY
- -33.4%
- Rents YoY
- 1.8%
- Active inventory
- 687
- Price-to-rent
- 6.9×
Monthly cashflow live
- Estimated rent
- $5,084 medium interval (Pro) →
- Mortgage (P&I)
- −$2,203
- Tax from tax record
- −$713 /mo · $8,557/yr
- Insurance
- −$175
- HOA
- −$45
- Vacancy / Maint / Mgmt
- −$1,068
- Net cashflow
- $881
Break-even live
Sensitivity live
| Price | -10% $1,119 | -5% $1,000 | +0% $881 | +5% $762 | +10% $643 |
|---|---|---|---|---|---|
| Rent | -10% $479 | -5% $680 | +0% $881 | +5% $1,082 | +10% $1,283 |
| Rate | -1.0pp $1,093 | -0.5pp $988 | base $881 | +0.5pp $772 | +1.0pp $662 |
UW: 25.0% down · 7.5% · 30yr · 1.5% tax · 5.0% vac · 8.0% maint · 8.0% mgmt
Financing live
Cash to close
- Down payment
- $105,000
- Closing costs
- $12,600
- Reserves months
- —
- Total cash needed
- —
Loan-product check · same deal, 3 products live
Conventional
25% down · 7.5% · 30yr
- Down + closing
- —
- Monthly P&I
- —
- Monthly cashflow
- —
- DSCR
- —
- Eligible?
- —
Personal DTI + credit; lowest rate.
DSCR
20% down · 8.5% · 30yr
- Down + closing
- —
- Monthly P&I
- —
- Monthly cashflow
- —
- DSCR
- —
- Eligible?
- —
No personal income docs; deal must DSCR.
Hard money
10% down · 12.0% · 12mo
- Down + closing
- —
- Monthly P&I
- —
- Monthly cashflow
- —
- DSCR
- —
- Eligible?
- —
Short-term bridge; refi at stabilization.
Rent comps 5 comps
| Address | Beds | Baths | Sqft | Rent | $/sqft | DOM | Units | Dist |
|---|---|---|---|---|---|---|---|---|
| 2435 Castle Pines Dr Burleson, TX | 4.0 | 3.0 | 3064 | $2,950 | $0.96 | 0d | 1 | 0.46mi |
| 2516 Castle Pines Dr Unit 1287532P Burleson, TX | 5.0 | 3.0 | 2507 | $16,227 | $6.47 | 23d | 1 | 0.47mi |
| 2516 Castle Pines Dr Burleson, TX | 5.0 | 3.0 | 2518 | $8,950 | $3.55 | 25d | 1 | 0.47mi |
| 2752 Elmwood Dr Burleson, TX | 4.0 | 2.0 | 2032 | $2,800 | $1.38 | 45d | 1 | 0.50mi |
| 1733 Trinity St Burleson, TX | 4.0 | 2.0 | 2213 | $4,900 | $2.21 | 4d | 1 | 1.39mi |
HOA detail
- Monthly dues
- $45 · $540/yr
- Likely covers
- landscaping
Listing history 12 events
-
2026-06-21days on market $420,000 Active 19 DOM
-
2026-06-18days on market $420,000 Active 16 DOM
-
2026-06-17days on market $420,000 Active 15 DOM
-
2026-06-16days on market $420,000 Active 14 DOM
-
2026-06-15days on market $420,000 Active 13 DOM
-
2026-06-13days on market $420,000 Active 11 DOM
-
2026-06-09days on market $420,000 Active 7 DOM
-
2026-06-08days on market $420,000 Active 6 DOM
-
2026-06-07days on market $420,000 Active 5 DOM
-
2026-06-04days on market $420,000 Active 2 DOM
-
2026-06-02remarks 693-char remark
-
2026-06-02$420,000 Active 1 DOM
ⓘ Source: listings_history table (triggers on properties + properties_extension) + one-shot
backfill from property_details.listing_events for pre-trigger history.
Tax reassessment forecast TX · Resets to sale price
- Current annual tax
- $8,557 · $713/mo
- Projected year-2 tax
- $8,557 · $713/mo
- Expected delta
- $0/yr ($0/mo · 0.0%)
ⓘ Screening estimate from a state-policy table — verify with the county assessor before closing.
Climate risk First Street
- Flood 1/10 Low FEMA zone X (unshaded) · 0% chance over 30 yrs
- Wildfire 4/10 Moderate
- Heat 7/10 Severe 7 d/yr ≥109°F today · 26 d/yr by 30 yrs out
- Wind 6/10 Major 27% chance of damaging wind over 30 yrs
- Air quality 2/10 Low 1 unhealthy d/yr today · 2 by 30 yrs out
Nearby sold comps map
Loading sold comps map…
Walkable amenities ~0.75 mi
Loading nearby amenities…
Taxation est. · year 1
- Rental income
- $61,014
- − Mortgage interest
- −$23,527
- − Property taxes
- −$8,557
- − Insurance
- −$2,100
- − Repairs & maintenance
- −$4,881
- − Management
- −$4,881
- − HOA
- −$540
- − Depreciation
- −$12,218
- Taxable income
- $4,310
- Est. tax owed @ 24.0%
- −$1,034
- After-tax cash flow
- $9,539/yr
For passive investors: Depreciation is non-cash, so a rental often shows a tax loss while cash-flowing — sheltering income. Rental losses are passive: they offset passive income freely, and up to $25,000/yr can offset ordinary (W-2) income if you actively participate and your MAGI is under $100k (phasing out to $0 by $150k); unused losses carry forward. On sale, claimed depreciation is recaptured at up to 25%, and gains may owe capital-gains tax (a 1031 exchange can defer both). Figures are a year-1 estimate at your 24.0% rate — not tax advice; consult a CPA.
Schools (NCES district)
- District
- Joshua ISD
- NCES district ID
- 4824930
- Math proficiency
- 52% ▼ -7.00%
- Reading proficiency
- 50% ▼ -1.00%
- Median HH income
- $60,696
- Composite
- 44.65/100
- National rank
- #2769
- State rank
- #139 of 826 in TX
Livability — Burleson
- Score
- 79/100
- State rank
- #53
- US rank
- #2133
Category grades
Schools grade is shown separately in the Schools card above.
Census & demographics
- Census place
- Burleson, TX
- County
- Johnson County · 147,987 people
- City population
- 81,549
- Metro
- Dallas-Fort Worth-Arlington, TX
- Population (ZIP)
- 81,549
- Household income
- $101,138
- Rent vs Own
- Severe rent burden
- 1117.0
Population outlook (Johnson County) Hauer SSP2
- Today (2025)
- 179,678 people
- By 2030
- 189,208 · +5.3%
- By 2040
- 207,261 · +15.4%
- By 2050
- 223,064 · +24.1%
- By 2075
- 259,979 · +44.7%
- By 2100
- 275,395 · +53.3%
Race, ethnicity, and origin ACS 2023
- Neighborhood character
- Predominantly White (69%)
- Race & ethnicity
- White 69% Hispanic / Latino 19% Two or more races 11% Black 6% Asian 1%
- Hispanic origin (detail)
- Mexican 17%
- Common ancestry
- Lithuanian 2% Italian 2% Slovak 2%
- Foreign-born
- 5% · Canada
- Languages at home
- 88% English-only · Spanish 10% Other Indo-European 1%
Political lean MEDSL · Johnson
- 2024 margin
- Solid R (+51.4) · D 23.9% · R 75.3%
- 2008→2024 swing
- -3.9pp toward R · 2008: -47.5pp · 2024: -51.4pp
- All cycles
- 2024: R+51.4 2020: R+53.0 2016: R+58.3 2012: R+55.6 2008: R+47.5
Not yet ingested
- Civics
- —
Market trends
- HPI YoY
- ▼ -141.44%
- Current HPI
- 282.466
- Rent YoY
- ▲ 1.78%
- Metro
- Dallas-Fort Worth-Arlington, TX
- State GDP YoY
- ▲ 3.95%
- F500 in state
- 110
Industry mix (Fortune 500 HQ in TX)
| Industry | F500 HQs | Revenue |
|---|---|---|
| Energy | 16 | $1,198B |
|
||
| Technology | 5 | $198B |
|
||
| Engineering / Construction | 4 | $72B |
|
||
| Energy Services | 3 | $60B |
|
||
| Utilities | 3 | $41B |
|
||
| Healthcare | 2 | $330B |
|
||
Price history
+90.9% since first listed19 events — show timeline
- 2026-06-01 Listed $420,000 NTREIS
- 2023-02-10 Sold (Public Records) — Public Records
- 2023-02-10 Sold (MLS) — NTREIS
- 2023-01-12 Pending — NTREIS
- 2022-11-29 Contingent — NTREIS
- 2022-11-29 Pending — NTREIS
- 2022-11-21 Contingent — NTREIS
- 2022-11-04 Price Changed $367,000 NTREIS
- 2022-10-19 Price Changed $374,900 NTREIS
- 2022-10-11 Price Changed $384,900 NTREIS
- 2022-09-14 Price Changed $389,000 NTREIS
- 2022-08-02 Listed $399,900 NTREIS
- 2022-07-08 Sold (Public Records) — Public Records
- 2016-07-20 Sold (Public Records) — Public Records
- 2016-07-20 Sold (MLS) — NTREIS
- 2016-06-25 Pending — NTREIS
- 2016-06-15 Contingent — NTREIS
- 2016-06-03 Listed $220,000 NTREIS
- 2006-05-16 Sold (Public Records) — Public Records
Property tax history
+4.7%/yrLatest (2025): $8,557 · +2.9% YoY. Source: county tax records.
Cash-flow waterfall
monthlySold comps — $/sqft
last 12 mo · ≤1 miLoading sold comps…