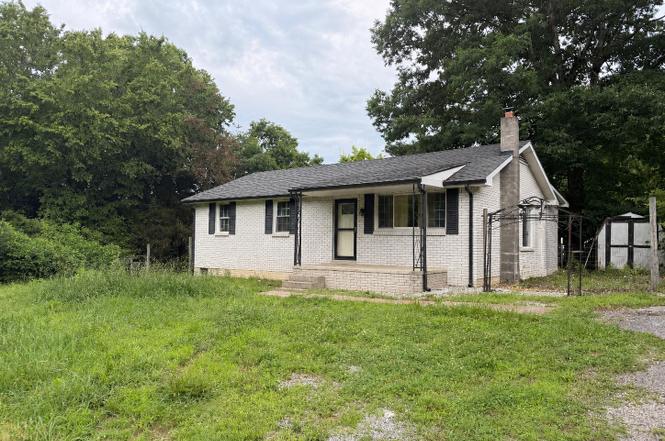
1180 Bandy Rd
Ashland City, TN 37015
$220,000D+
3 bd · 1.0 ba ·
1,050 sqft ·
Built 1975
· SingleFamily
· Coming Soon
· 3 DOM
Cashflow @ list (25.0% down · 7.5%)
Estimated rent
$1,753/mo
Mortgage (P&I)
−$1,154
Tax + insurance
−$171
HOA
−$0
Vac / Maint / Mgmt
−$368
Net cashflow
$60/mo
Annual
$717/yr
Cap rate
6.62%
Cash-on-cash
1.16%
DSCR
1.05
1% rule
0.80%
Cash to close
$61,600
Investor read
- This is a 3-bed/1.0-bath single-family listed at $220k.
- At list price, monthly cash flow is $60 ($717/yr) — positive.
- The deal already cash-flows at list — no discount required.
- To meet the 1% rule (rent ≥ 1% of price), the offer needs to be $175k (20.3% below list).
- Only 3 days on market — expect competitive offers; lowballing is unlikely to land.
- Recommended offer: $175k (20.3% below list) — sets the bar for 1% rule.
- Local home prices are declining (-3.0%/yr); year-one equity from $2k of loan paydown is wiped out by about $7k of value loss. Plan a longer hold.
- Location reads 65/100 on livability (#138 in TN) — a middle-class / working-renter tenant base. Strengths: crime A+, cost of living A+, housing A+; Watch: amenities F, commute F, health & safety F.
- Cheatham County (rural): math 24% / reading 28% proficiency, ranked #74 of 139 in TN (top 53%) — low school quality limits family demand, transient renter base, plan for 1-2y turnover.
- Zoned schools: East Cheatham Elementary (math 32% / reading 27%, grade F, #423 of 952 statewide, top 48%, 393 students, 0% FRL); Sycamore High School (math 2% / reading 37%, grade F, #183 of 332 statewide, top 59%, 712 students, 0% FRL) — zoned schools average 0% FRL vs 40% district-wide (40 pts lower); this property's tenant base skews higher-income than the district average.
- Market conditions: Rents rising (+2.1%/yr); 167 active listings in the ZIP; 1 comparable units currently listed for rent nearby; solid renter incomes; 271 units permitted in Cheatham County in 2024 (0 in 5+ unit buildings).
- Current owner paid $93k; list at $220k implies a 137% gain — meaningful room to come down on a strong offer.
- Climate carrying-cost: extreme-heat days projected 7→19/yr by 2055 (HVAC capex compounding) — expect insurance premiums to compound above CPI over the hold.
- Cap rate 6.6% vs local median 3.4% in Ashland City — top-decile yield for the area; either an underpriced asset or a hidden risk that comps aren't pricing in. Stress-test before assuming the spread holds.
Questions for listing agent
- Built in 1975 — when were the roof, HVAC, electrical panel, plumbing, and water heater last replaced?
- Is there a deadline driving the sale (1031 exchange, divorce, estate, relocation)? That informs how much negotiation room exists.
- Schools are F-rated, which usually means shorter tenancies and higher turnover. Who's the typical renter profile here, and what's been the actual vacancy rate?
- The area grade is low — what's the realistic commute time and amenity access for the typical tenant pool here? Any planned neighborhood developments (good or bad) we should know about?
- What's the average days-on-market for RENTAL listings here right now (not sales)? A rising rental-DOM trend means longer vacancies and softer asking-rent achievability than the comps imply.
- What's the recent tenant-quality profile in this submarket — average credit score on applications, eviction rate, late-payment / NSF rate, and stable-employment percentage? A property-management company in the area should have these aggregated.
- How much new for-sale + rental construction is in the pipeline within 1–3 miles? Heavy new supply typically softens prices + rents 12–24 months out; constrained supply supports both.
CashFlowRE · CFR-5PCXYY7DM0TEWH
· Data 2 days ago
cashflowre.app · 2026-05-29