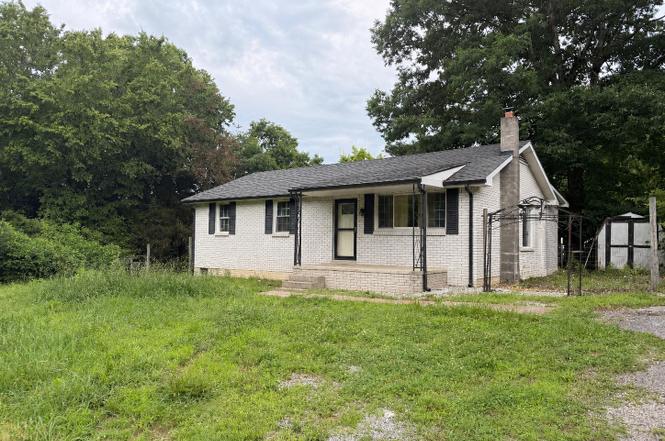
1180 Bandy Rd · Ashland City, TN
Flood risk 1/10 · Minimal
- FEMA flood zone
- X (unshaded)
- Chance of flooding over 30 yrs
- 0.0%
- Est. flood insurance / yr
- $507 – $1,088
Fire risk 4/10 · Minor
- Est. fire insurance / yr
- $949 – $1,763
Heat risk 5/10 · Moderate
- Hot days now (above 106°F)
- 7 days/yr
- Hot days in 30 yrs
- 19 days/yr
Wind risk 4/10 · Minor
- Chance of severe wind over 30 yrs
- 10.0%
Air-quality risk 2/10 · Minimal
- Unhealthy air days now
- 1 days/yr
- Unhealthy air days in 30 yrs
- 2 days/yr
Risk factors via First Street. Map © Google.
Why this score? — see what drove the D+ grade
The composite is a weighted blend of 9 inputs, each scored 0–100. Each bar is that input's sub-score; the figure is the points it added to the 100-point composite (weight × sub-score).
- ARV discount +15.0/15.0
- Cash flow +14.8/30.0
- DSCR +4.5/10.0
- Livability +3.2/5.0
- 1% rule +3.0/10.0
- Rent growth +3.0/5.0
- Condition / age +2.5/5.0
- Schools +2.3/10.0
- Appreciation +0.0/10.0
$220,000
🖨 Deal sheet 📄 Offer letter ✓ Due diligence
Listing remarks
All Brick 3 bed, 1 bath house. Newer roof, HVAC and appliances. Great investment opportunity, being sold as is.
Key facts
- 9,583 sq ft lot
- Built 1975
- Listed 3 days
Property features AI
Finance
- Other: Lot approximately 0.22 acres (dimensions: 95 x 97.42 x 95.10 x 101.73); Living area reported as 1,050 square feet
- HOA & community: Pets allowed
Exterior
- Utilities: Public water; Public sewer; Water available
- Home design: Single-family residence; One level
- Construction: Brick construction; Asphalt roof; Block foundation; Existing (year built not specified)
- Exterior features: Covered porch
Interior
- Kitchen: Electric oven, Electric range, Dishwasher
- Bedrooms: 3 bedrooms (all on main level)
- Flooring: Laminate flooring
- Bathrooms: 1 full bathroom
- Heating & cooling: Heat pump heating; Central air conditioning
- Interior features: Electric oven; Electric range; Dishwasher
Neighborhood map
What this means for you Summary
Snapshot
- This is a 3-bed/1.0-bath single-family listed at $220k.
Deal economics
- At list price, monthly cash flow is $60 ($717/yr) — positive.
- The deal already cash-flows at list — no discount required.
- To meet the 1% rule (rent ≥ 1% of price), the offer needs to be $175k (20.3% below list).
- Recommended offer: $175k (20.3% below list) — sets the bar for 1% rule.
- Cap rate 6.6% vs local median 3.4% in Ashland City — top-decile yield for the area; either an underpriced asset or a hidden risk that comps aren't pricing in. Stress-test before assuming the spread holds.
Location & tenants
- Location reads 65/100 on livability (#138 in TN) — a middle-class / working-renter tenant base. Strengths: crime A+, cost of living A+, housing A+; Watch: amenities F, commute F, health & safety F.
- Cheatham County (rural): math 24% / reading 28% proficiency, ranked #74 of 139 in TN (top 53%) — low school quality limits family demand, transient renter base, plan for 1-2y turnover.
- Zoned schools: East Cheatham Elementary (math 32% / reading 27%, grade F, #423 of 952 statewide, top 48%, 393 students, 0% FRL); Sycamore High School (math 2% / reading 37%, grade F, #183 of 332 statewide, top 59%, 712 students, 0% FRL) — zoned schools average 0% FRL vs 40% district-wide (40 pts lower); this property's tenant base skews higher-income than the district average.
- Market conditions: Rents rising (+2.1%/yr); 167 active listings in the ZIP; 1 comparable units currently listed for rent nearby; solid renter incomes; 271 units permitted in Cheatham County in 2024 (0 in 5+ unit buildings).
Forward outlook
- Local home prices are declining (-3.0%/yr); year-one equity from $2k of loan paydown is wiped out by about $7k of value loss. Plan a longer hold.
Negotiation context
- Only 3 days on market — expect competitive offers; lowballing is unlikely to land.
- Current owner paid $93k; list at $220k implies a 137% gain — meaningful room to come down on a strong offer.
Risks & watch-outs
- Climate carrying-cost: extreme-heat days projected 7→19/yr by 2055 (HVAC capex compounding) — expect insurance premiums to compound above CPI over the hold.
Questions for the listing agent
- Built in 1975 — when were the roof, HVAC, electrical panel, plumbing, and water heater last replaced?
- Is there a deadline driving the sale (1031 exchange, divorce, estate, relocation)? That informs how much negotiation room exists.
- Schools are F-rated, which usually means shorter tenancies and higher turnover. Who's the typical renter profile here, and what's been the actual vacancy rate?
- The area grade is low — what's the realistic commute time and amenity access for the typical tenant pool here? Any planned neighborhood developments (good or bad) we should know about?
- What's the average days-on-market for RENTAL listings here right now (not sales)? A rising rental-DOM trend means longer vacancies and softer asking-rent achievability than the comps imply.
- What's the recent tenant-quality profile in this submarket — average credit score on applications, eviction rate, late-payment / NSF rate, and stable-employment percentage? A property-management company in the area should have these aggregated.
- How much new for-sale + rental construction is in the pipeline within 1–3 miles? Heavy new supply typically softens prices + rents 12–24 months out; constrained supply supports both.
Investment metrics
- 1% rule
- 0.80% ✗
- Cap rate
- 6.62%
- Cash-on-cash
- 1.16%
- DSCR
- 1.05
- GRM
- 10.5
CMA / ARV
- ARV (on-the-fly)
- $302,400
- Comps found
- 3
Show comp detail 3 sales within ~0.75 mi
| Address | Dist | Beds/Ba | Sqft | Sold | Price | $/sf | Match |
|---|---|---|---|---|---|---|---|
| 1035 Granada Rd | 0.28mi | 3/1.0 | 1,025 (-2%) | 23mo | $298,000 | $291 | 64 |
| 1053 Granada Rd | 0.36mi | 3/1.5 | 1,025 (-2%) | 20mo | $295,000 | $288 | 61 |
| 1024 Granada Rd | 0.16mi | 2/2.0 (-1) | 1,096 (+4%) | 22mo | $260,000 | $237 | 58 |
Match score weights: distance 35% · size 25% · config 20% · recency 20%. Top-matched comps best support the ARV.
Projected returns pro-forma
-3.0% appreciation · 2.13% rent growth · sell at horizon
- IRR
- -15.4%
- Equity multiple
- 0.46×
- Total profit
- $-33,459
- Equity at exit
- $32,803
- IRR
- -8.3%
- Equity multiple
- 0.50×
- Total profit
- $-30,750
- Equity at exit
- $19,022
Cash invested: $61,600 (down + closing). Projections, not guarantees.
Landlord ↔ Tenant lean methodology
- Overall (STATE)
- 87 Strongly Landlord-Friendly
- State Tennessee
- 87 Strongly Landlord-Friendly · R+13
- County
- — inherits STATE
- City
- — inherits STATE
ZIP-level market 37015
- Home prices YoY
- -21.7%
- Rents YoY
- 2.1%
- Active inventory
- 167
- Price-to-rent
- 10.5×
Monthly cashflow live
- Estimated rent
- $1,753 medium interval (Pro) →
- Mortgage (P&I)
- −$1,154
- Tax from tax record
- −$79 /mo · $953/yr
- Insurance
- −$92
- HOA
- −$0
- Vacancy / Maint / Mgmt
- −$368
- Net cashflow
- $60
Break-even live
UW: 25.0% down · 7.5% · 30yr · 1.5% tax · 5.0% vac · 8.0% maint · 8.0% mgmt
Financing live
Cash to close
- Down payment
- $55,000
- Closing costs
- $6,600
- Reserves months
- —
- Total cash needed
- —
Loan-product check · same deal, 3 products live
Conventional
25% down · 7.5% · 30yr
- Down + closing
- —
- Monthly P&I
- —
- Monthly cashflow
- —
- DSCR
- —
- Eligible?
- —
Personal DTI + credit; lowest rate.
DSCR
20% down · 8.5% · 30yr
- Down + closing
- —
- Monthly P&I
- —
- Monthly cashflow
- —
- DSCR
- —
- Eligible?
- —
No personal income docs; deal must DSCR.
Hard money
10% down · 12.0% · 12mo
- Down + closing
- —
- Monthly P&I
- —
- Monthly cashflow
- —
- DSCR
- —
- Eligible?
- —
Short-term bridge; refi at stabilization.
Rent comps 1 comps
| Address | Beds | Baths | Sqft | Rent | $/sqft | DOM | Units | Dist |
|---|---|---|---|---|---|---|---|---|
| 2199 Bandy Rd Ashland City, TN | 2.0 | 2.0 | 864 | $1,400 | $1.62 | 10d | 1 | 0.95mi |
Listing history 4 events
-
2026-06-18days on market $220,000 Coming Soon 3 DOM
-
2026-06-17days on market $220,000 Coming Soon 2 DOM
-
2026-06-15remarks 111-char remark
-
2026-06-15$220,000 Coming Soon 1 DOM
ⓘ Source: listings_history table (triggers on properties + properties_extension) + one-shot
backfill from property_details.listing_events for pre-trigger history.
Tax reassessment forecast TN · Resets to sale price
- Current annual tax
- $953 · $79/mo
- Projected year-2 tax
- $1,562 · $130/mo
- Expected delta
- +$609/yr (+$51/mo · 63.9%)
ⓘ Screening estimate from a state-policy table — verify with the county assessor before closing.
Climate risk First Street
- Flood 1/10 Low FEMA zone X (unshaded) · 0% chance over 30 yrs
- Wildfire 4/10 Moderate
- Heat 5/10 Major 7 d/yr ≥106°F today · 19 d/yr by 30 yrs out
- Wind 4/10 Moderate 10% chance of damaging wind over 30 yrs
- Air quality 2/10 Low 1 unhealthy d/yr today · 2 by 30 yrs out
Nearby sold comps map
Loading sold comps map…
Walkable amenities ~0.75 mi
Loading nearby amenities…
Taxation est. · year 1
- Rental income
- $21,031
- − Mortgage interest
- −$12,323
- − Property taxes
- −$953
- − Insurance
- −$1,100
- − Repairs & maintenance
- −$1,682
- − Management
- −$1,682
- − Depreciation
- −$6,400
- Taxable loss
- −$3,111
- Est. tax savings @ 24.0%
- +$747
- After-tax cash flow
- $1,463/yr
For passive investors: Depreciation is non-cash, so a rental often shows a tax loss while cash-flowing — sheltering income. Rental losses are passive: they offset passive income freely, and up to $25,000/yr can offset ordinary (W-2) income if you actively participate and your MAGI is under $100k (phasing out to $0 by $150k); unused losses carry forward. On sale, claimed depreciation is recaptured at up to 25%, and gains may owe capital-gains tax (a 1031 exchange can defer both). Figures are a year-1 estimate at your 24.0% rate — not tax advice; consult a CPA.
Schools (NCES district)
- District
- Cheatham County
- NCES district ID
- 4700570
- Math proficiency
- 24% ▼ -15.00%
- Reading proficiency
- 28% ▼ -4.00%
- Median HH income
- $53,027
- Composite
- 23.17/100
- National rank
- #7949
- State rank
- #74 of 139 in TN
Livability — Ashland City
- Score
- 65/100
- State rank
- #138
- US rank
- #12483
Category grades
Schools grade is shown separately in the Schools card above.
Census & demographics
- County
- Cheatham County · 18,988 people
- City population
- 18,988
- Metro
- Nashville-Davidson--Murfreesboro--Franklin, TN
- Population (ZIP)
- 18,988
- Household income
- $79,092
- Rent vs Own
- Severe rent burden
- 396.0
Population outlook (Cheatham County) Hauer SSP2
- Today (2025)
- 41,312 people
- By 2030
- 41,739 · +1.0%
- By 2040
- 41,726 · +1.0%
- By 2050
- 40,413 · -2.2%
- By 2075
- 37,125 · -10.1%
- By 2100
- 31,619 · -23.5%
Race, ethnicity, and origin ACS 2023
- Neighborhood character
- Predominantly White (89%)
- Race & ethnicity
- White 89% Hispanic / Latino 6% Two or more races 4% Black 2%
- Hispanic origin (detail)
- Mexican 5%
- Common ancestry
- Slovak 3% Serbian 2% Italian 2%
- Foreign-born
- 3% · Canada
- Languages at home
- 95% English-only · Spanish 4%
Political lean MEDSL · Cheatham
- 2024 margin
- Solid R (+45.9) · D 26.3% · R 72.3% · Other 1.4%
- 2008→2024 swing
- -14.2pp toward R · 2008: -31.7pp · 2024: -45.9pp
- All cycles
- 2024: R+45.9 2020: R+44.0 2016: R+46.9 2012: R+37.0 2008: R+31.7
Not yet ingested
- Civics
- —
Market trends
- HPI YoY
- ▼ -87.06%
- Current HPI
- 313.8358
- Rent YoY
- ▲ 2.13%
- Metro
- Nashville-Davidson--Murfreesboro--Franklin, TN
- State GDP YoY
- ▲ 2.78%
- F500 in state
- 22
Industry mix (Fortune 500 HQ in TN)
| Industry | F500 HQs | Revenue |
|---|---|---|
| Healthcare | 3 | $91B |
|
||
| Retail | 3 | $72B |
|
||
| Transportation / Logistics | 1 | $88B |
|
||
| Paper / Packaging | 1 | $19B |
|
||
| Insurance | 1 | $13B |
|
||
| Energy | 1 | $12B |
|
||
Price history
+161.9% since first listed3 events — show timeline
- 2026-06-15 Coming Soon $220,000 REALTRACS as Distributed by MLS Grid
- 2019-07-01 Sold (Public Records) $93,000 Public Records
- 2014-12-18 Sold (Public Records) $84,000 Public Records
Property tax history
+5.4%/yrLatest (2025): $953 · +11.3% YoY. Source: county tax records.
Cash-flow waterfall
monthlySold comps — $/sqft
last 12 mo · ≤1 miLoading sold comps…